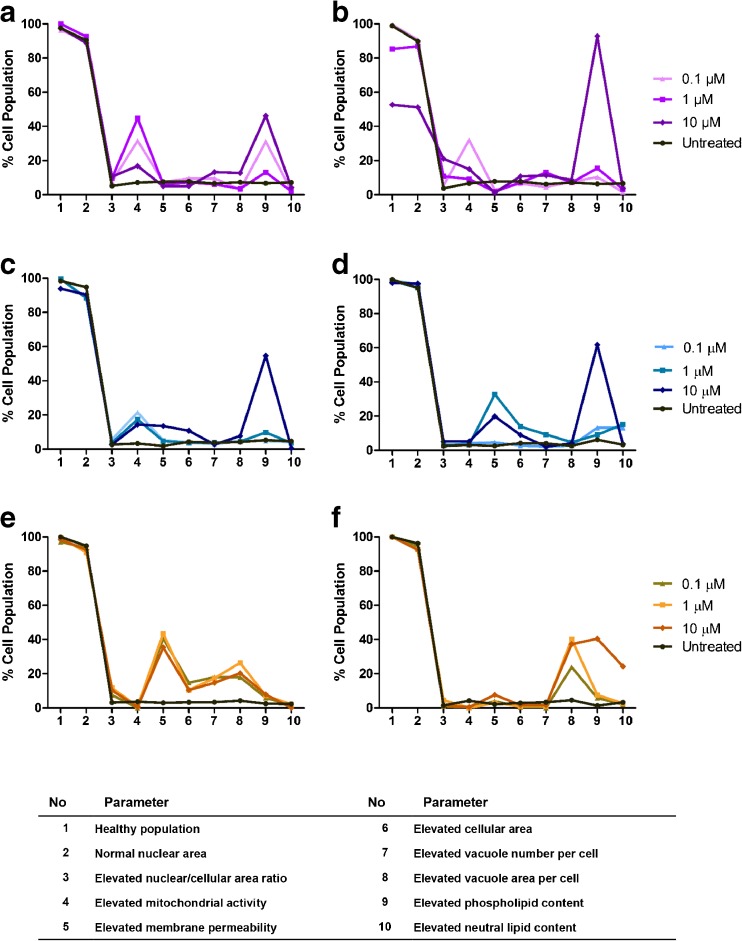
Fig. 5.
Cell health, morphology and lipid multi-parameter profiles after amiodarone exposure. Multi-parameter charts profiling cell health, morphology and lipid changes to the NR8383 rat alveolar macrophage cell line (a, b), U937 human monocyte-derived macrophage cell line (c, d) and primary rat macrophages obtained from BAL (e, f) after 24 h (a, c, e) and 48 h (b, d, f) exposure to 0–10 μM amiodarone. Data is represented as mean of 3 experiments where n = 6 for each investigation.

