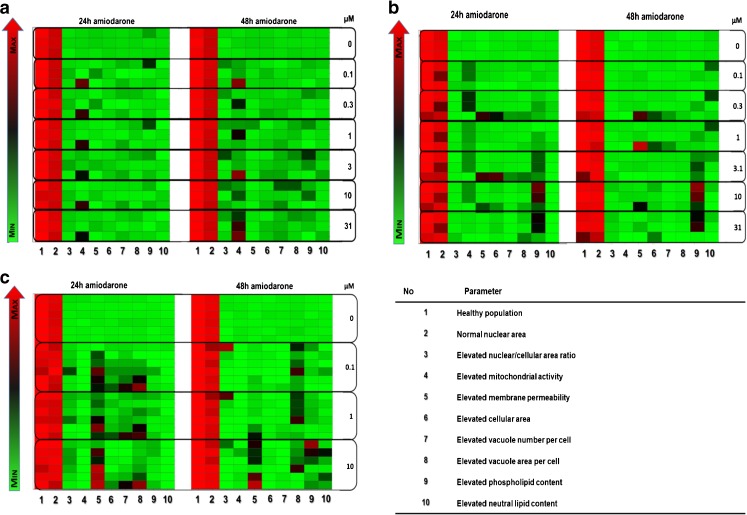
Fig. 6.
Heat map indicating experimental variability. Variability of profile parameters for cells exposed to 0–10 μM amiodarone for 24 and 48 h for the NR8383 rat alveolar macrophage cell line (a), U937 human monocyte-derived macrophage cell line (b) and primary rat macrophages obtained from BAL (c). Each square represents one experiment. The colour gradient sets the lowest value for each given parameter in the heat map (bright green), highest value (bright red) and mid-range values (black) with a corresponding gradient between these extremes.

