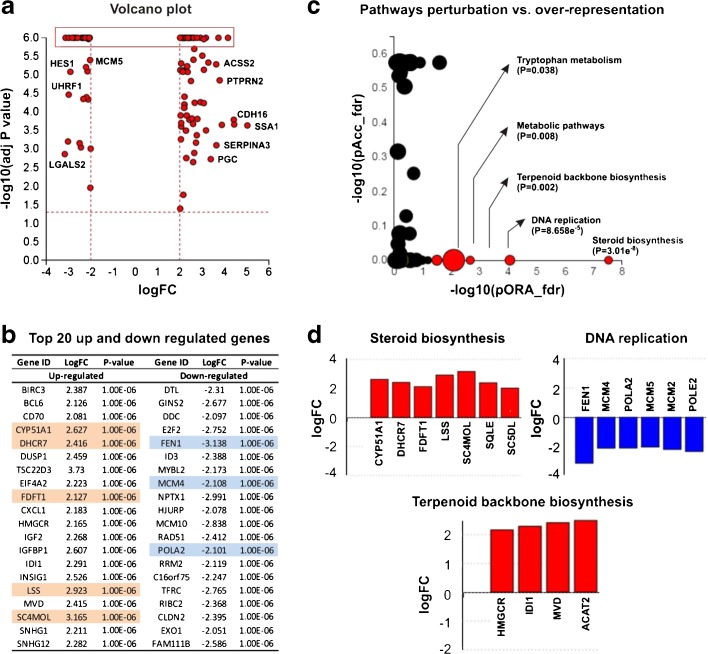
Fig. 3.
Whole human genome microarray analysis of A549 cells incubated for 24 h with simulated lung fluid (SLF) or standard tissue culture media. Panel (a) - Volcano plot: All 116 significantly differentially expressed (DE) genes are displayed according to their measured expression change (x-axis) and negative log (base 10) of the p-value (y-axis). The higher the gene is plotted on the y-axis, the more significant it is. The dotted line shows the thresholds for expression change; p < 0.05. The top 20 up and down regulated genes, reflecting the highlighted section in panel A are provided in panel (b). Panel (c) - Pathways perturbation vs over-representation: The most disrupted pathways are plotted in terms of the two types of evidence: over-representation on the x-axis (pORA) and the total perturbation accumulation on the y-axis (pAcc). Red spots indicate significantly perturbed pathways, with the size of the spot reflecting the number of DE genes within the identified pathways. Panel (d) illustrates the DE genes within the three most significant pathways identified as perturbed following incubation with the SLF.

