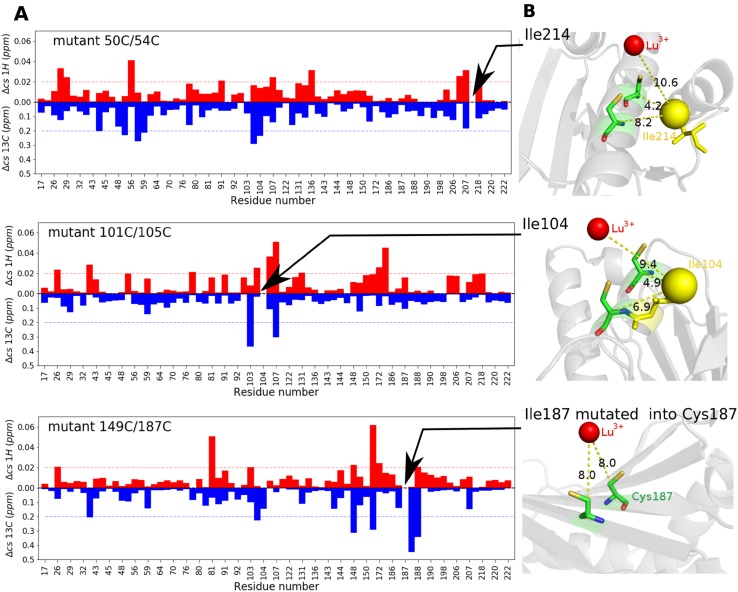
Fig. 2.
Mutation and tagging effects. a Absolute chemical shift differences between WT and Lu3+-tagged mutant ntd-HSP90 resonances for 1H (red) and 13C (blue) are plotted for each methyl group. The dotted lines mark significant changes, with 0.2 ppm for 13C and 0.02 for 1H. b Location of methyl groups with unmatched resonances relative to the tag site. Distances are expressed in Ångström

