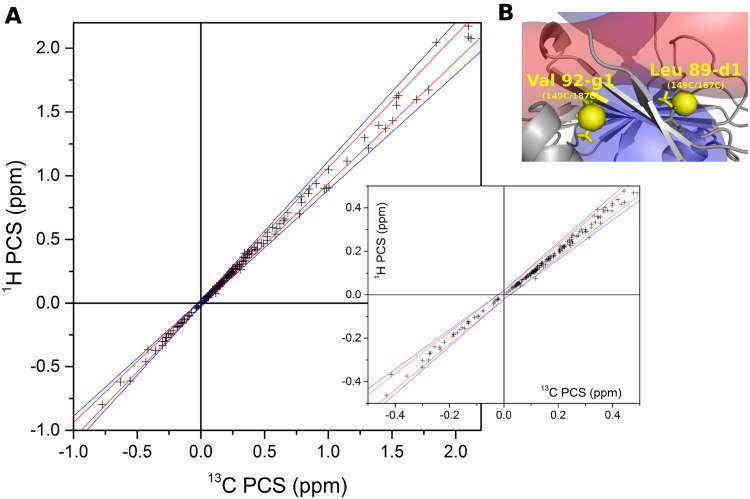
Fig. 3.
Correlation between the 1H PCS and 13C PCS of methyl groups. a The 1H and 13C methyl PCS predicted for the three tag positions on ntd-HSP90 are plotted. The PCS differing < 5% and 10% are contained between the red and blue lines, respectively. The inset shows a detail of the plot for small PCS. The lines intercept the axes at |0.02| ppm, taken as error margin. b Location of the two methyl groups, for the mutant 149C/187C, for which the deviation between 1H and 13C PCS is bigger than 10%. Isosurfaces are shown for PCS = 0.25 and − 0.25 ppm. Both methyl groups are very close to the region where the PCS changes sign

