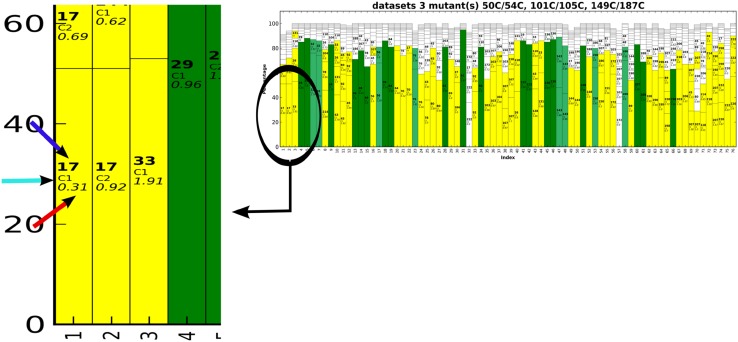
Fig. 7.
PARAssign output for the complete experimental dataset. The highly reliable assignments are shown in green and the proposed reliable assignments are in yellow. In this example, all the green assignments are correct and 95% of the yellow assignments contain the correct assignment (among 1–4 possibilities). In the close-up the blue, cyan and red arrows indicate the residue number, the stereospecificity and the scoring factor, respectively

