FIG 5.

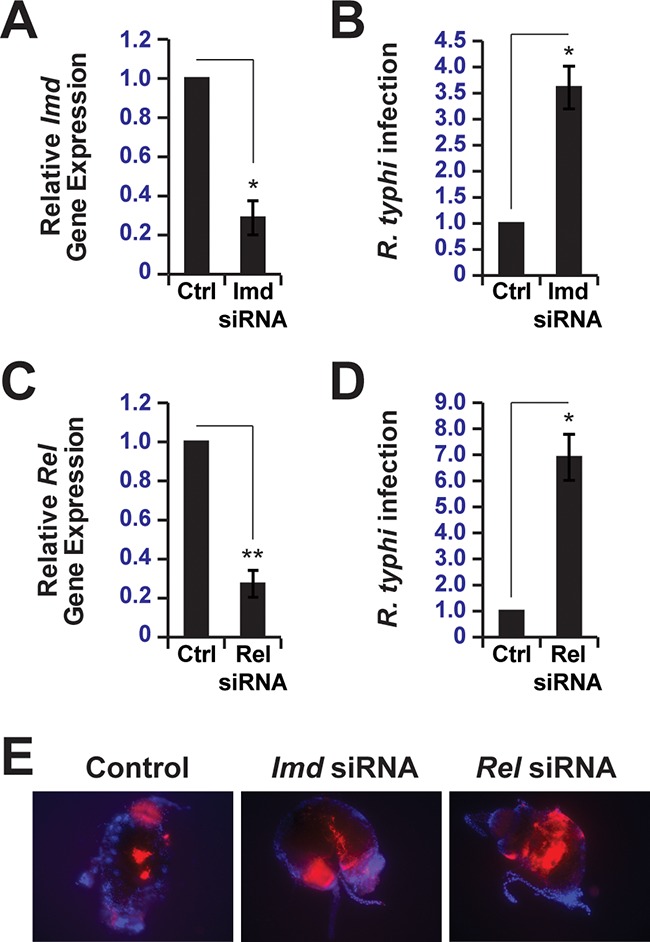
The IMD signaling pathway controls R. typhi burden in C. felis. (A) RT-qPCR analysis of Imd transcripts from fleas fed blood meals containing control (Ctrl) or Imd siRNAs. Data were normalized to the housekeeping genes Actin and Ef and fleas fed blood meals containing control siRNAs. Error bars indicate SEMs. *, P < 0.05. (B) Analysis of R. typhi infection in fleas fed blood meals containing control or Imd siRNAs by RT-qPCR. Data were normalized to the housekeeping genes Actin and Ef and fleas fed blood meals containing control siRNAs. Error bars indicate SEMs. *, P < 0.05. (C) Same as in panel A except that Rel transcripts from fleas fed blood meals containing control or Rel siRNAs were analyzed by RT-qPCR. Error bars indicate SEMs. **, P < 0.01. (D) Same as in panel B except that Rel siRNAs were used in blood meals instead of Imd siRNAs. Error bars indicate SEMs. *, P < 0.05. (E) Representative images of mCherry-R. typhi (red) infection in isolated flea midguts. Fleas were fed blood meals containing control, Imd, or Rel siRNAs and mounted on slides using ProLong Gold antifade mountant with DAPI (blue). Separate images were obtained using DAPI and TRITC filter sets and merged to generate the composite images shown.
