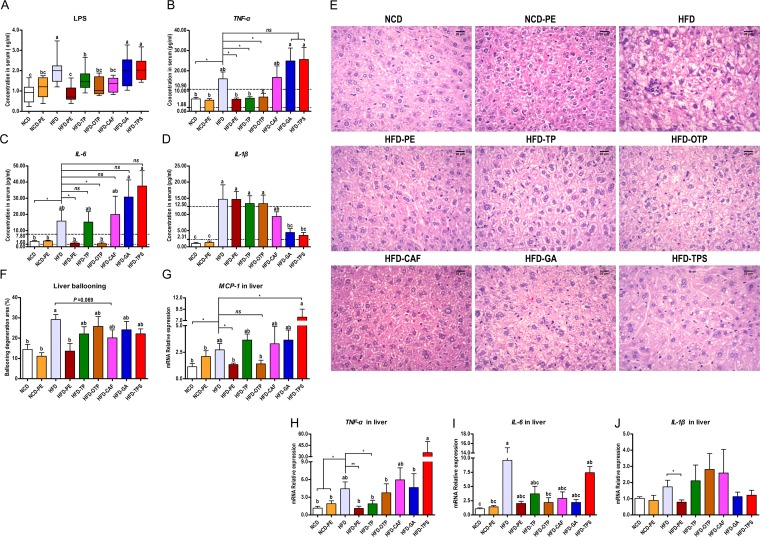
FIG 2.
Effects of PEAC administration on metabolic endotoxemia and systemic and hepatic inflammation. Results for blood serum LPS (A), TNF-α (B), IL-6 (C), and IL-1β (D). (E) Photomicrographs of hematoxylin and eosin (H&E)-stained liver sections. (F) Ballooning degeneration area (%) in the liver. (G to J) mRNA expression of liver inflammatory factors is shown for monocyte chemotactic protein-1 (MCP-1) (G), TNF-α (H), IL-6 (I), and IL-1β (J). The data are expressed as the means ± SEM. n = 8 to 10 (A to F); n = 6 (G to J). Data with different lowercase letters are significantly different (P < 0.05) according to the post hoc one-way ANOVA statistical analysis. Asterisks indicate a significant difference between two groups using the unpaired two-tailed Student t test (*, P < 0.05; **, P < 0.01).

