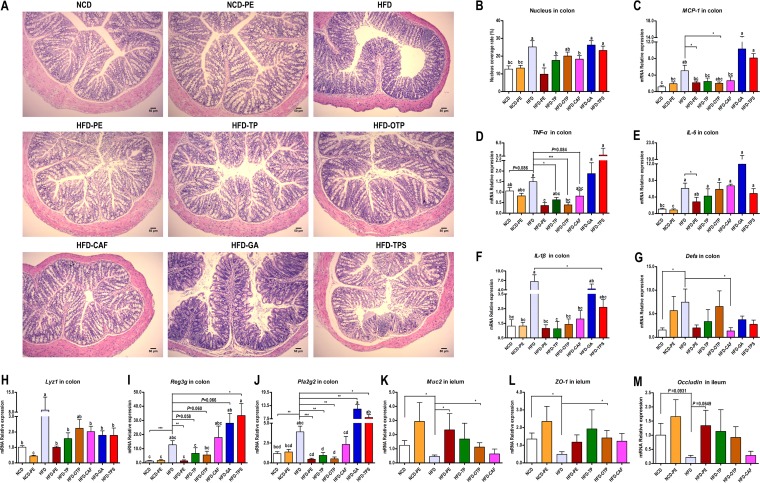
FIG 5.
Effects of PEAC administration on intestinal homeostasis in mice. (A) Photomicrographs of H&E-stained proximal colon sections. Infiltration of inflammatory cells into the tissue are shown in blue in the photomicrographs in the HFD, HFD-GA, and HFD-TPS groups. (B) Percent coverage of the nucleus in proximal colon tissue. (C to F) Expression of inflammation genes in the proximal colon, including MCP-1 (C), TNF-α (D), IL-1β (E), and IL-6 (F). (G to J) Expression of barrier integrity and AMPs genes in the proximal colon, including α-defensins (encoded by Defa) (G), lysozyme C (encoded by Lyz1) (H), regenerating islet-derived 3-gamma (encoded by Reg3g) (I), and phospholipase A2 group II (encoded by Pla2g2) (J). (K to M) Expression of barrier integrity genes in the distal ileum, including Muc2 (K), occludin (L), and ZO-1 (M). The data are expressed as the means ± SEM; n = 8 to 10 (B), n = 6 (C to M). Data with different lowercase letters are significantly different (P < 0.05) according to the post hoc one-way ANOVA statistical analysis. Asterisks indicate a significant difference between two groups using the unpaired two-tailed Student t test (*, P < 0.05; **, P < 0.01; ***, P < 0.001).

