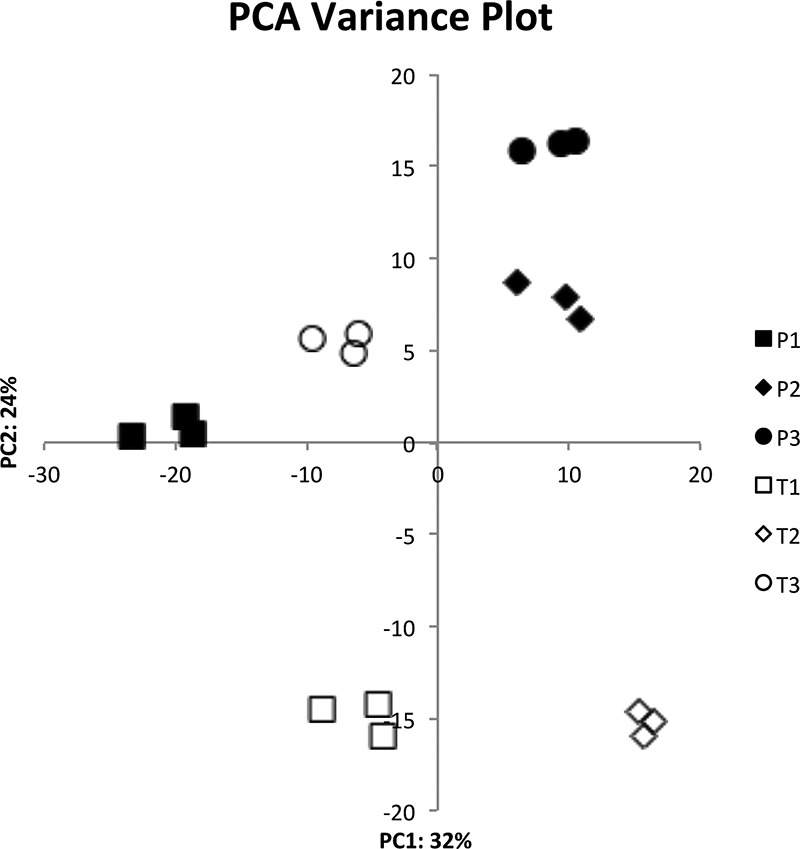
FIG 2.

Principal-component analysis (PCA) plot of RNA-seq data. The PCA plot shows the variance of the three experimental replicates of each of the three transient-infection strains (T1, T2, and T3) and the three persistent-infection strains (P1, P2, and P3). The percentages on each axis represent the percentages of variation explained by the principal components.
