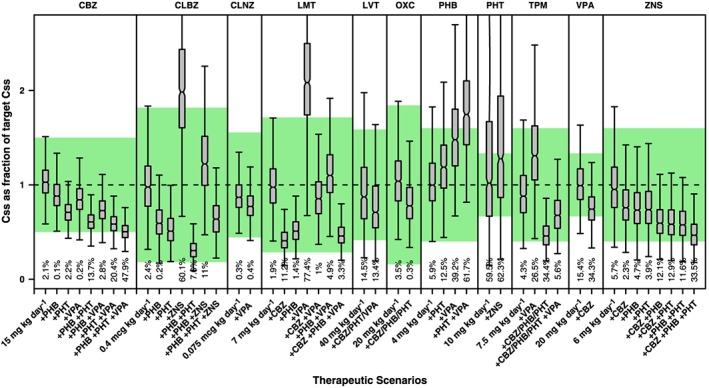
Figure 4.

Whisker‐box plots show the median, quartiles and 95% prediction intervals for the steady‐state concentrations (Css) achieved in children receiving polytherapy. Different and drug–drug interaction scenarios are presented for each antiepileptic drug based on commonly used combinations in clinical practice. Shaded area depicts the reference therapeutic range; numbers shown below the bars are percentages of the population with Css values outside the reference therapeutic range. See text for details on the population PK models, covariate effects and simulation procedures. CBZ= carbamazepine, CLBZ= clobazam, CLNZ= clonazepam, LMT= lamotrigine, LVT= levetiracetam, OXC= oxcarbazepine, PHB= phenobarbital, PHT= phenytoin, TPM= topiramate, VPA= valproic acid, ZNS= zonisamide
