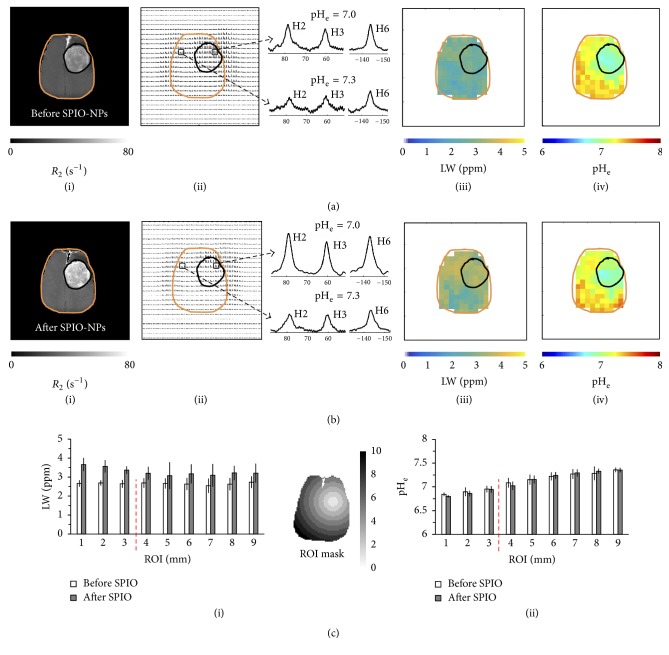
Figure 2.
Multimodal data of relaxation rate (R2), chemical shift imaging (CSI), linewidth (LW), and extracellular pH (pHe) maps obtained for the same RG2 tumor-bearing rat in Figure 1, which had undergone renal ligation. ((a)(i)–(iv)) represent maps before the SPIO-NPs infusion while ((b)(i)–(iv)) represent the maps after the SPIO-NPs infusion. The R2 maps were used to delineate and localize the tumor (black outline) and brain (orange outline) boundaries on the CSI, LW, and pHe maps. R2 values inside the tumor increased significantly after infusion of SPIO-NPs. The CSI maps were used to create the LW maps and pHe maps. The LW increased after SPIO-NPs infusion especially in the tumor. The pHe values within the tumor core and also on the tumor margin were lower than in the healthy/nontumor regions. The panels between the CSI and the LW maps show examples of 1H spectra of TmDOTP5− protons from voxels inside and outside the tumor, revealing a significant intratumoral and peritumoral LW and pHe difference. A more detailed comparison was done using a region of interest (ROI) analysis of LW ((c)(i)) and pHe ((c)(ii)) maps before and after the infusion of SPIO-NPs, using the ROI mask shown. The scale bar in the mask denotes 0 to 10 mm diameter circular ROIs (portrayed on a representative rat brain slice). The red dashed line denotes the demarcation between tumor (ROIs 1–3) and tumor edge (ROI 4)/nontumor regions (ROIs 5–9). See Figure S3 for an example of multimodal data of an RG2 tumor rat that underwent coinfusion of probenecid and TmDOTP5−.

