Figure 1.
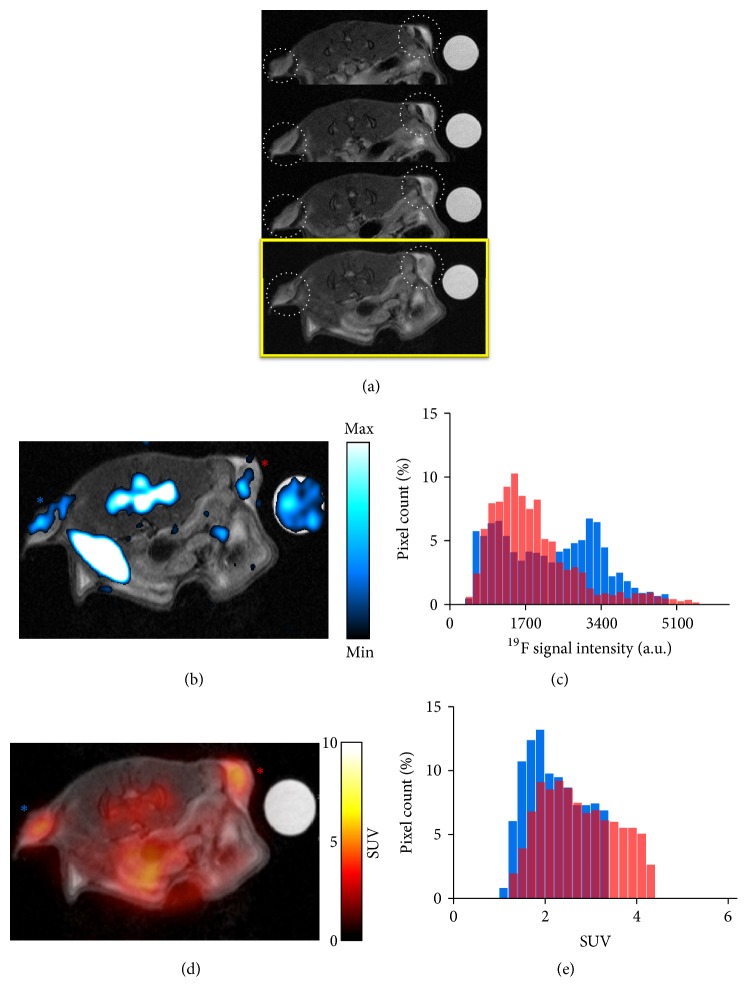
In vivo 19F-MRI and PET and histogram analysis on day 2. (a) Serial 1H MR image slices with tumors indicated with dotted white circles. The last slice in yellow box is the slice that is coregistered with corresponding 19F-MR image and 18F-FDG-PET image in (b) and (d), respectively. (b) Superimposition of an anatomical proton MR image and its corresponding 19F-MR image. 19F signals are detected not only from tumors, but also from the bone marrow, the spleen, and a reference tube placed on the right side of the mouse. (c) Histogram of 19F pixel intensities from left and right tumors. Blue and red are from left (blue asterisk) and right (red asterisk) tumors in (b). (d) Coregistration of the same anatomical MR image as that used in image A and its corresponding 18F-FDG-PET image. (e) Histogram of PET SUV from left and right tumors. Blue and red are from left (blue asterisk) and right (red asterisk) tumors in (d). 19F, fluorine-19; MRI, magnetic resonance imaging; PET, positron emission tomography; 2-FDG, fluoro-2-deoxy-D-glucose; SUV, standardized uptake value.

