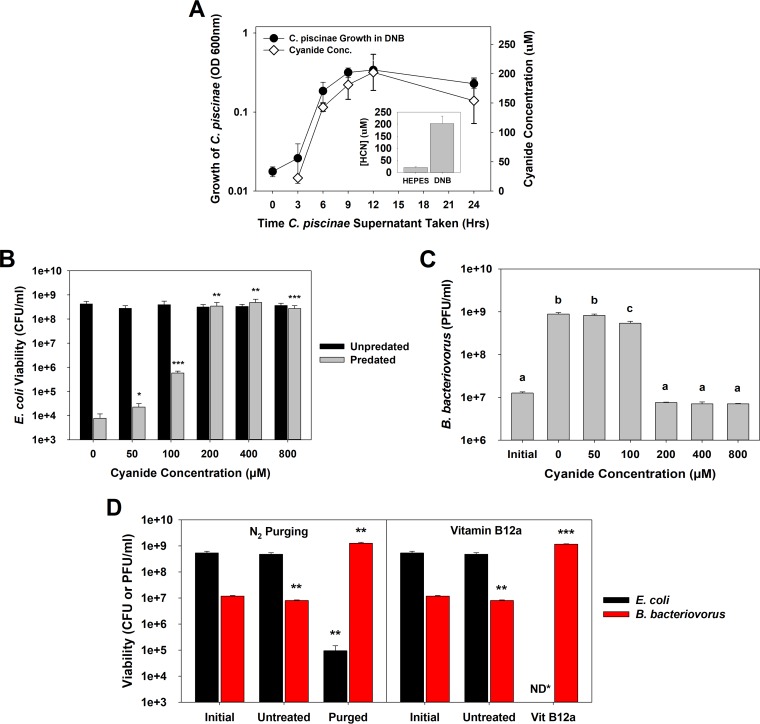
FIG 3 .
(A) Cyanogenesis by cultures of C. piscinae grown in DNB. The C. piscinae growth results are the same as in Fig. 1C. This experiment was repeated three times. (Inset) Average cyanide concentrations seen after 24 h from 13 independent experiments. (B) Potassium cyanide inhibition of predation. E. coli MG1655 was used as the prey strain. The surviving prey populations were determined after 24 h. The results show that cyanide concentrations of 50 µM and higher significantly inhibit predation. Statistical analyses were performed against the no-cyanide control samples. A PPR of approximately 0.03 was used. The values for pairs of values (predated and unpredated samples) were compared. Values that are significantly different are indicated by asterisks as follows: *, P < 0.05; **, P < 0.01; ***, P < 0.001. The experiment was performed four times. (C) B. bacteriovorus HD100 numbers after predation in the presence of cyanide. The population was determined using the cultures after 24 h from panel B, confirming that cyanide concentrations of 100 µM and higher significantly inhibit predation. Values that are not statistically significantly different (P < 0.05) are indicated by the same letter (letter a, b, or c). This experiment was repeated four times. (D) Purging of the supernatant (n = 3) or treating it with hydroxocobalamin (n = 4) restores the ability of B. bacteriovorus HD100 to attack. E. coli MG1655 was used as the prey. The medium was treated for 1 h prior to the predation experiment was performed. The values were compared to the values for the untreated control samples. The viabilities of both the predator and prey were determined after 24 h. The values were compared to the value for the respective initial populations. Values that are significantly different are indicated by asterisks as follows: **, P < 0.01; ***, P < 0.001. ND*, not detected (<103 CFU/ml).

