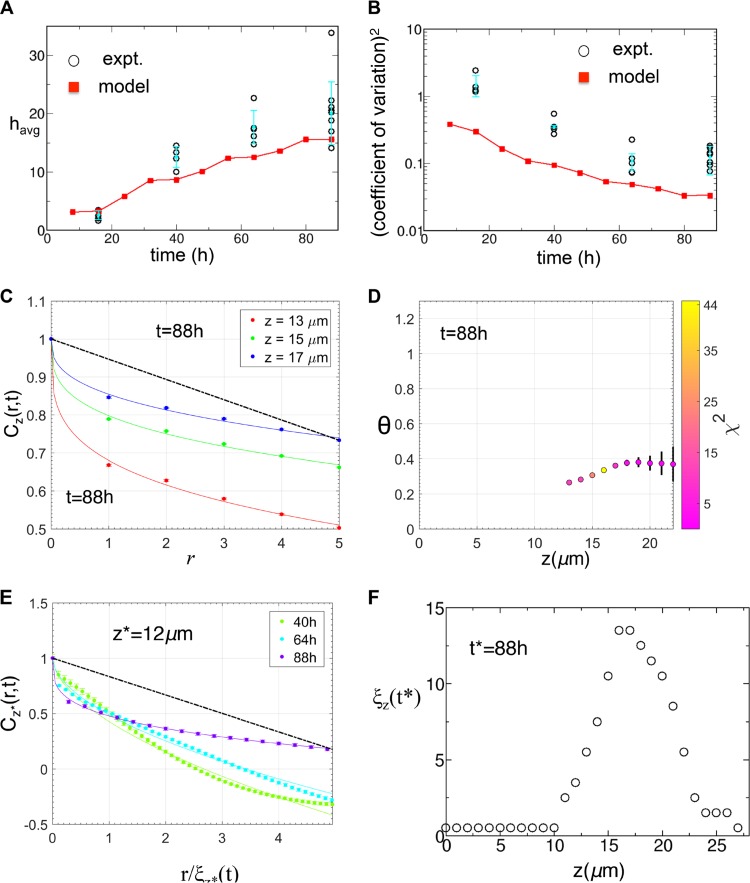
FIG 5 .
Comparison of the biofilm profiles between the in silico model and the in vitro experiments for WT NTHI. (A) The kinetics of the average biofilm height (havg) obtained from the in silico model (red squares) was compared against that for the in vitro NTHI biofilms (circles). The average heights for the in vitro NTHI biofilms were calculated at t = 16 h, 40 h, 64 h, and 88 h for multiple replicates. havg for each replicate is displayed. The mean values of havg calculated for different biofilm replicates formed in vitro and the associated error bars are shown in filled circles in cyan. (B) Comparison of the (coefficient of variation)2, calculated for the biofilm surfaces obtained from in silico simulations (red squares) and in vitro experiments (circles). The mean values of the (coefficient of variation)2 calculated for different biofilm replicates formed in vitro and the associated error bars are shown in filled circles in cyan. (C) Variation of Cz(r,t*)/Cz(0,t*) with r at short distances (≤5 μm) for multiple z planes for the in silico biofilm at t* = 88 h. The data were averaged over 30,000 initial configurations. The solid lines show the fits of equation 3 to the data. All the fits produces θ values of <1, in qualitative agreement with the in vitro data (Fig. 2A and B). The dashed black line shows the θ = 1 case as a reference. (D) Values of θ at different z planes obtained by fitting the Cz(r,t*)/Cz(0,t*) data for the in silico biofilm at t* = 88 h. θ values are not shown where the C(r,t) decreased substantially in length scales of r ≤ 1 μm, comparable to the compartment size (l0 = 1 μm). The θ values close to the biofilm surface also are not shown, due to large errors in the estimations due to the large errors in the data for Cz(r,t*) near the biofilm surfaces. The symbol colors display the χ2 values for the fits used to estimate the θ values. (E) Variation of Cz*(r,t)/Cz(0,t*) with r/ξz*(t) at larger distances for multiple times (t* = 40 h, 64 h, and 88 h) for the in silico biofilm at z* = 12 μm. The data show any absence of scaling, which is in agreement with the in vitro data (Fig. 3A). (F) Variation of the correlation length ξz(t*) (unit, μm) with z at t* = 88 h. The initial rise in ξz(t*) followed by a decrease as we approached the biofilm tip from the substrate was in qualitative agreement with the in vitro data (Fig. 3B, inset).

