Figure 3.
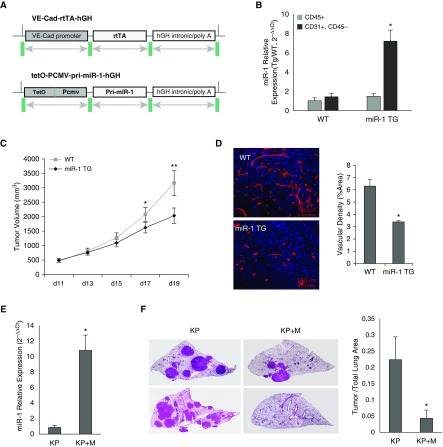
The effects of vascular-specific microRNA-1 (miR-1) in the transgenic model. (A) Constructs used for the generation of inducible endothelial-specific transgenic mouse. VE-Cad-rtTA-hGH: contains vascular endothelial cadherin (VE-Cad) promoter, reverse tetracycline transactivator (rtTA), and human growth hormone (hGH) intronic, nuclear localization, and polyadenylation sequences. tet-O-pCMV-pri-miR-1-hGH: contains a polymeric tetracycline operator (tet-O), minimal cytomegalovirus (CMV) promoter, and hGH intronic, polyadenylation, and nuclear localization signals flanking its multiple cloning site. Primary (pri)-miR-1 sequence was cloned between the hGH intronic sequence and tet-O-CMV promoter. (B) miR-1 levels were measured in endothelial (CD31+, CD45−) and immune (CD45+) cell fractions isolated from wild-type and miR-1 transgenic (miR-1 TG) mice. Bar graphs represent mean level of miR-1 expressed as 2−∆∆Ct value (see supplementary methods for description of normalization). The asterisk indicates significant increase in CD31+ CD45− fraction as compared to CD45+ fraction in the miR-1 TG group (n = 4 per group; *P = 0.001768). (C and D) The effects of miR-1 transgene expression on tumor growth and angiogenesis in Lewis lung carcinoma model. Tumor implantation and volume measurements performed as described in Figure 2E (n ≥ 4 from three experiments; *P = 0.033645; **P = 0.007521). (D) Tumors sections were stained with anti-CD31 antibody and analyzed for vascular density as described in Figure 2G. (Left) Representative images of tumors. (Right) Quantification of CD31-positive area (vascular density) expressed as percentage of the whole area examined (n ≥ 12 from three experiments; *P = 0.017903). (E and F) The effect of endothelial miR-1 in Kirsten rat sarcoma viral oncogene homolog (KRAS)/transformation-related protein 53 (P53) knockout (KP) model. KP and KP + M mice (KP cross with miR-1-TG mice) received Cre recombinase at 1 month of age. miR-1 overexpression was induced by adding doxycycline to the drinking water 5 months after Cre delivery and lungs were harvested 6 months after Cre delivery. (E) Relative expression of miR-1 (miR-1/18s in KP + M and KP mice normalized to the levels in KP mice) in endothelial cells isolated from these lungs (n = 9 from 2 experiments; *P = 0.001211). (F) Lungs were sectioned (5 μm) and stained with hematoxylin and eosin. Tumor burden was determined by measuring tumor area/whole lung area. (Left) Representative images of the lungs from two mice in each group (each image was assembled from multiple smaller images at ×400 magnification). (Right) Quantification of tumor burden in the two groups (n = 9 from two experiments; *P = 0.02887). Error bars represent SEM. WT = wild-type.

