Figure 6.
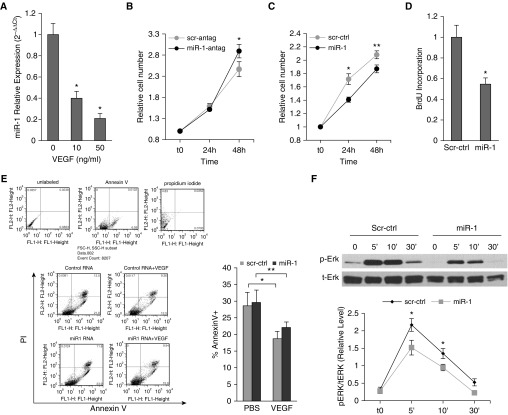
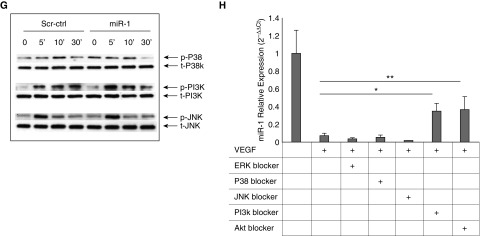
The role and regulation of microRNA-1 in human primary endothelial cells. (A) miR-1/18s levels were measured in human umbilical vein endothelial cells (HUVECs) stimulated with 10 ng or 50 ng/ml of recombinant human vascular endothelial growth factor (VEGF). Values were normalized to the mean of the control group and expressed as 2−∆∆Ct (n ≥ 15 from five experiments; *P < 0.0001). (B–E) HUVECs were transfected with miR-1 antagomir (miR-1-antag), mature miR-1 double-stranded mimic (miR-1), or their respective scrambled controls (scr-antag, or scr-ctrl). HUVECs were then starved overnight and stimulated with VEGF (10 ng/ml). (B) The effects of miR-1-antag and its control on proliferation were measured and presented as in Figure 5A (n = 12 from two experiments; *P = 0.043). (C) The effects of miR-1 and its control on proliferation were measured and presented as in Figure 5A (n = 16 from three experiments; *P = 0.00194; **P = 0.0307). (D) The effects of miR-1 and scr-ctrl on bromodeoxyuridine incorporation (de novo DNA synthesis) was measured and presented as in Figure 5D (n = 20 from four experiments; *P = 0.00123). (E) The effect of miR-1 and scr-ctrl on cell death was analyzed by fluorescence-activated cell sorter analysis for Annexin V and propidium iodide (PI). (Left) Results of a typical fluorescence-activated cell sorter analysis experiments. (Top) Results of staining with each reagent in a representative experiment. (Bottom left) Representative dot plots for each experimental group. (Bottom right) Quantification of apoptotic cell fraction defined as a percentage of Annexin V–positive cells (n ≥ 6 from two experiments; *P = 0.028; **P = 0.047). (F and G) HUVECs were transfected with miR-1 or scr-ctrl, starved overnight, and stimulated with VEGF. Reaction was stopped at 5, 10, or 30 minutes and cells were lysed. Phosphorylated and total extracellular signal–regulated protein kinase (ERK) (p-ERK and t-ERK, respectively) fractions were detected by Western blotting. (F) Representative immunoblot (top) and quantification of the activated ERK1/2 (p-ERK/t-ERK) (bottom) (x-axis shows time in minutes) (n = 8; *P < 0.04). (G) Representative immunoblots for activated (phosphorylated, p-) and total (t-) P38 mitogen-activated protein kinase (P38K), phosphoinositide 3-kinase (PI3K), and c-jun N-terminal kinase (JNK). (H) HUVECs were starved, incubated with blockers, and stimulated with VEGF for 24 hours. miR-1 was measured as described in Figure 2 (n ≥ 10 from five experiments; *P < 0.001; **P < 1 × 10⁻⁵). Error bars represent SEM. BrdU = bromodeoxyuridine; FSC = forward scatter; PBS = phosphate-buffered saline; SSC = side scatter.


