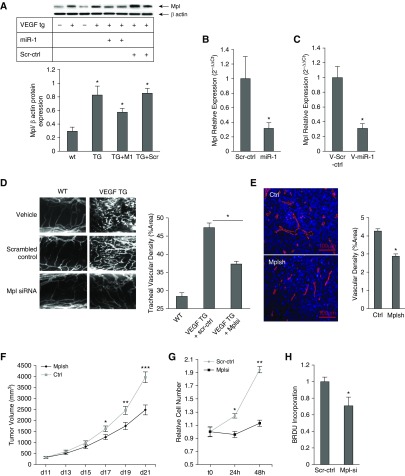
Figure 7.
The role of myeloproliferative leukemia virus oncogene (Mpl) in angiogenesis and tumor growth. (A) Mpl expression was detected by Western blot analysis in the lungs of vascular endothelial growth factor (VEGF) transgenic (TG) mice (VEGF TG+) and their wild-type (WT) littermates (WT/VEGF TG−) that received double-stranded microRNA-1 (miR-1) or scrambled control (Scr-ctrl) RNA. (Top) Representative Western blot. (Bottom) Results of densitometric analysis (TG+M1 = VEGF TG + miR-1) (n = 3; *P and **P < 0.05). (B) Mpl expression was measured by Taqman quantitative real-time polymerase chain reaction in lung endothelial cells isolated from mice that received intranasal miR-1 or Scr-ctrl-RNA. The graph shows Mpl/glyceraldehyde phosphate dehydrogenase levels normalized to the control group and expressed as 2−ΔΔCt (n = 11 from four experiments; *P < 0.03). (C) A similar measurement as shown in B on lung endothelial cells from mice that received vascular-specific lenti-miR-1 (V-miR-1) or control (V-Scr-ctrl). The graph shows Mpl/glyceraldehyde phosphate dehydrogenase levels normalized to the control group and expressed as 2−ΔΔCt (n = 8, from two experiments; *P < 0.002). (D) VEGF-TG and -WT mice received small interfering RNA (siRNA) against Mpl (Mplsi) or Scr-ctrl. Tracheas were isolated and angiogenesis was assessed as described in Figure 4A. (Left) Representative images of tracheal vessels from WT and TG mice treated with vehicle (buffer), Mpl siRNA, or scrambled control RNA (n = 9 from three experiments; P < 0.0005). (E) Lewis lung carcinoma implants were injected with lentiviral vector containing Mpl short hairpin RNA (shRNA) (Mplsh) or the control vector (Ctrl). Tumors were harvested on Day 21 and vascularity assessed after staining with anti-CD31 antibody (n = 14 from two experiments; *P = 0.004923). (F) Tumor sizes were measured at the indicated time points and volumes calculated as in Figure 2E (n = 17 from two experiments; *P = 0.01606, **P = 0.00302, ***P = 4.07 × 10⁻⁵). (G and H) Mouse lung endothelial cells were transfected with Mplsi or Scr-ctrl and stimulated with VEGF (50 ng/ml). (G) Cell proliferation was measured as described in Figure 1D (n = 24 from four experiments; *P < 0.01, **P < 0.00001). (H) BrdU incorporation was compared between the two groups (values were normalized to the control reaction, n = 20 from four experiments; *P = 0.02). Error bars represent SEM. BrdU = bromodeoxyuridine.

