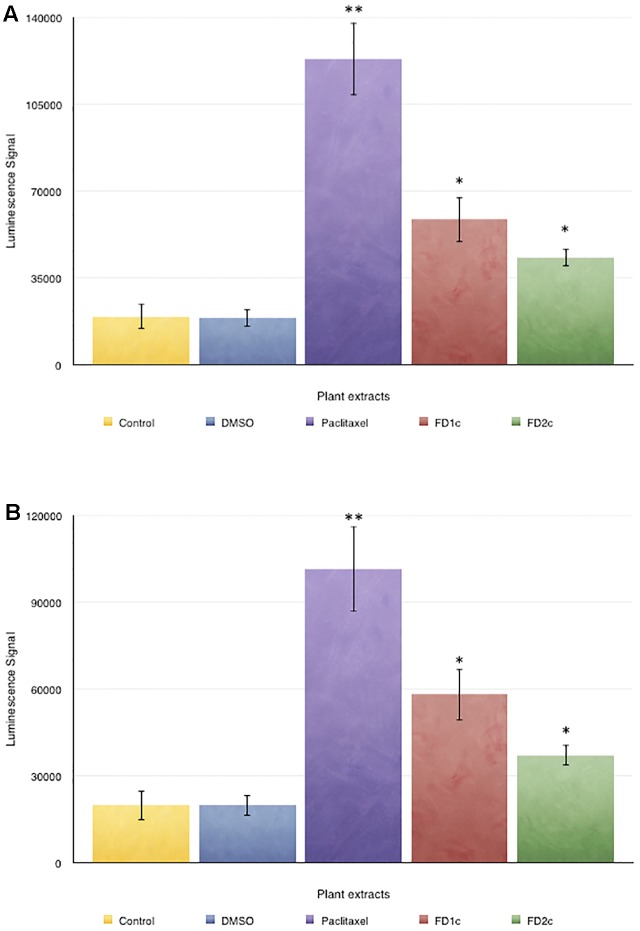
FIGURE 3.
Caspase 3/7 activity in (A) PC3 and (B) LNCaP cells treated with the active extracts of Ficus deltoidea L. for 72 h. The y-axis shows the luminescent signal subtracted from a blank, which is proportional to the caspases activity. The error bars display the standard error of mean (SEM) obtained from three independent experiments. Significance compared to control, ∗P < 0.05, ∗∗P < 0.01 as determined by un-paired t-test.

