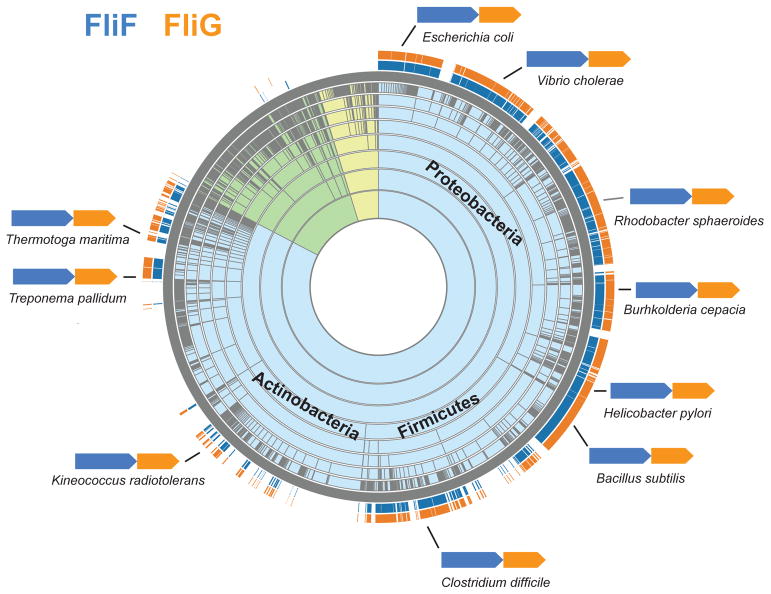
Figure 1.
Taxonomic distribution and gene order of fliF and fliG. The distribution of fliF and fliG shown on a taxonomic species tree was generated using the Aquerium tool (http://aquerium.utk.edu/) and the gene order was retrieved from the MiST database (http://mistdb.com/). Background color of the sunburst tree indicates species of Bacteria (light blue), Archaea (light yellow) and Eukaryota (light green).

