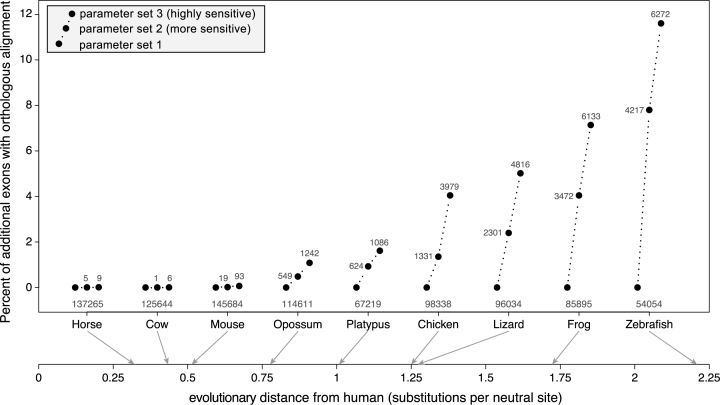
Figure 2.
Sensitive alignment parameters can uncover thousands of new alignments between exons of orthologous genes. The figure compares the number of exons that align between orthologous genes for nine species at various evolutionary distances to human (axis at the bottom). Three alignment parameter sets were tested that differ in their sensitivity. The Y-axis shows the percent increase relative to the number of aligning exons with parameter set 1. The absolute number of aligning exons with parameter set 1 is given below the black dots, the absolute increase obtained with parameter set 2 and 3 is given alongside or above the black dots.

