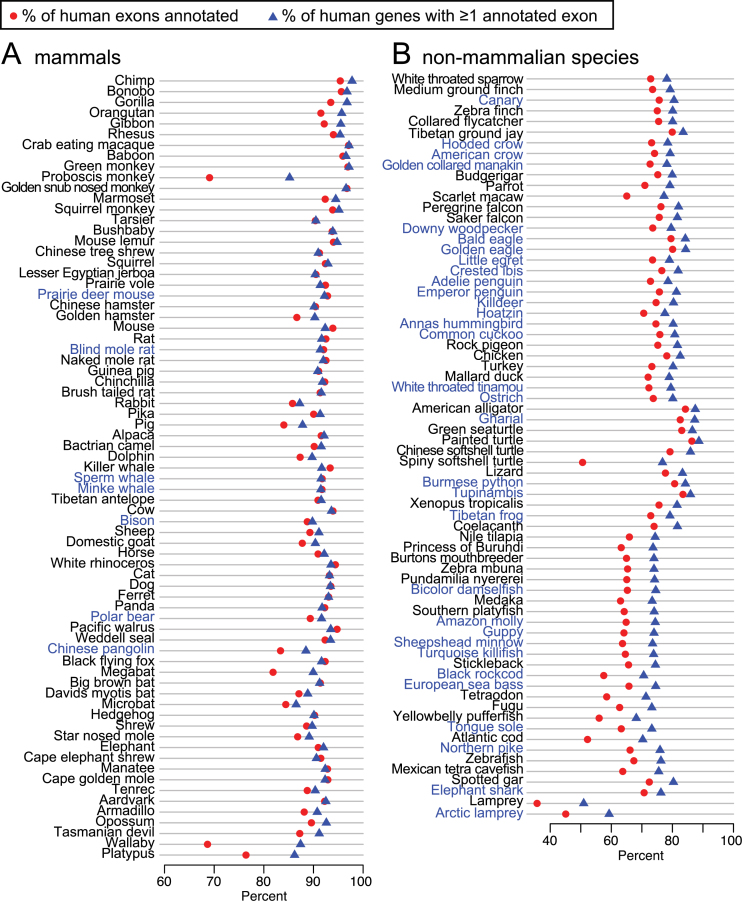
Figure 4.
Comparative gene annotation in 143 vertebrate genomes. The X-axis shows the proportion of human exons (red circles) and genes for which CESAR annotated at least one exon (blue triangle) in 73 mammals (A) and 70 non-mammalian vertebrates (B). Species in blue font are not contained in the UCSC 100-way or primate alignment.

