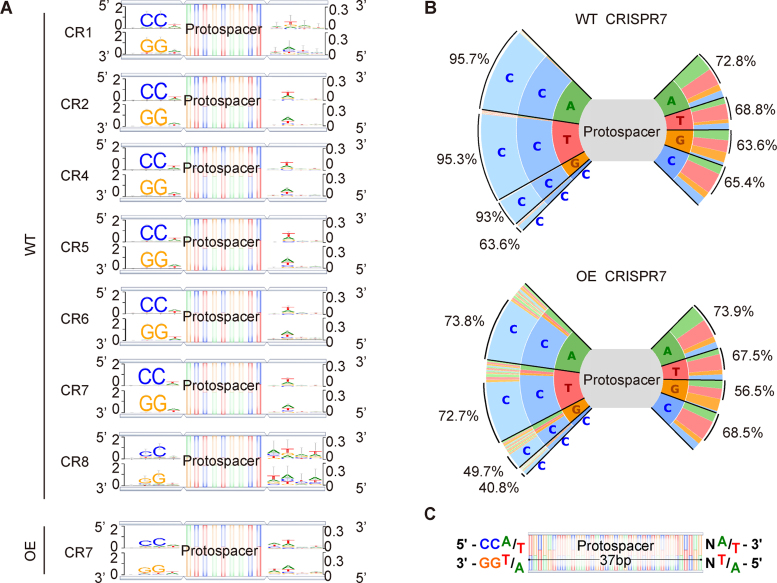
Figure 3.
Analysis of PAM sequences in adaptation. (A) Newly-acquired spacers in each CRISPR array were used to search the genome and plasmids in order to identify the corresponding protospacers, and upstream and downstream sequences were extracted and used to generate consensus motifs on both strands of DNA. Four bp of flanking sequence on each side of the protospacers is shown. (B) Plots show the frequencies of all 3 bp flanking sequences upstream of the protospacer and 2 bp downstream of the protospacer for CRISPR7 in the WT and OE strains. Percentages on left side indicate proportion of spacers with CC at the second and third position and percentages on right side indicate proportion of spacers with W (A/T) at the second position. (C) Based on the observed consensus sequences, a model of the ideal upstream and downstream motifs was made.

