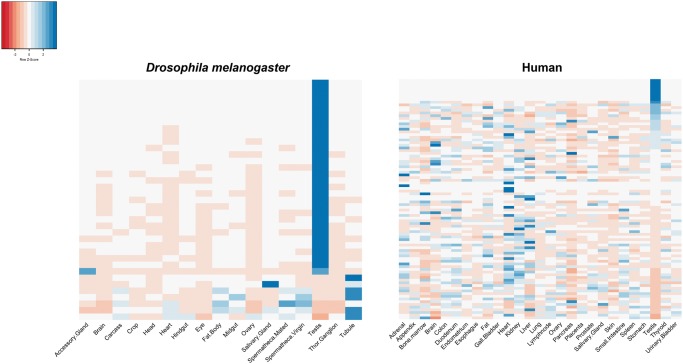
Fig. 1.—
Heatmap of gene expression for N-mt duplicated genes from Drosophila (left) and human (right). Only new duplicated N-mt genes (i.e., genes for which the child status was confirmed) are shown on the Y axis ranked by their Z score for testis. Only adult tissues are shown on the X axis (27 out of 32 tissues for human, and 17 out of 27 tissues for D. melanogaster). Raw expression data was transformed into Z scores to show the extent of tissue-biased expression. Expression levels higher/lower than the mean expression across all tissues have positive/negative Z scores as indicated by blue/pink colors.

