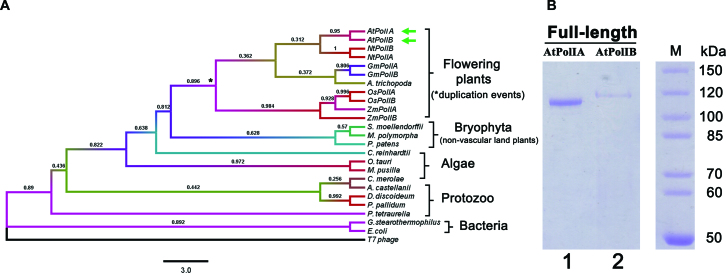
Figure 2.
Phylogenetic analysis of POPs and heterologous purification of AtPolIs. (A) Phylogenetic tree constructed from POPs from land plants, algae and protozoan. Representative bacterial and T-odd bacteriophage DNAPs were included for comparison. A multiple sequence alignment was used to construct a phylogenetic tree using the neighbor joining algorithm, bootstrap values were calculated from 1000 trials and the evolutionary distances were constructed using the Poisson correction method. The bar indicates the numbers of substitutions per site. The significance of each branch of the phylogenetic tree is indicated by its bootstrap percentage. (B) 10% Coomassie blue stained SDS-PAGE gel showing the purification of full-length AtPolIA and AtPolIB after three purification steps: IMAC, phosphocellulose and heparin chromatography AtPolIs were purified as a single protein bands of ∼115 kDa.

