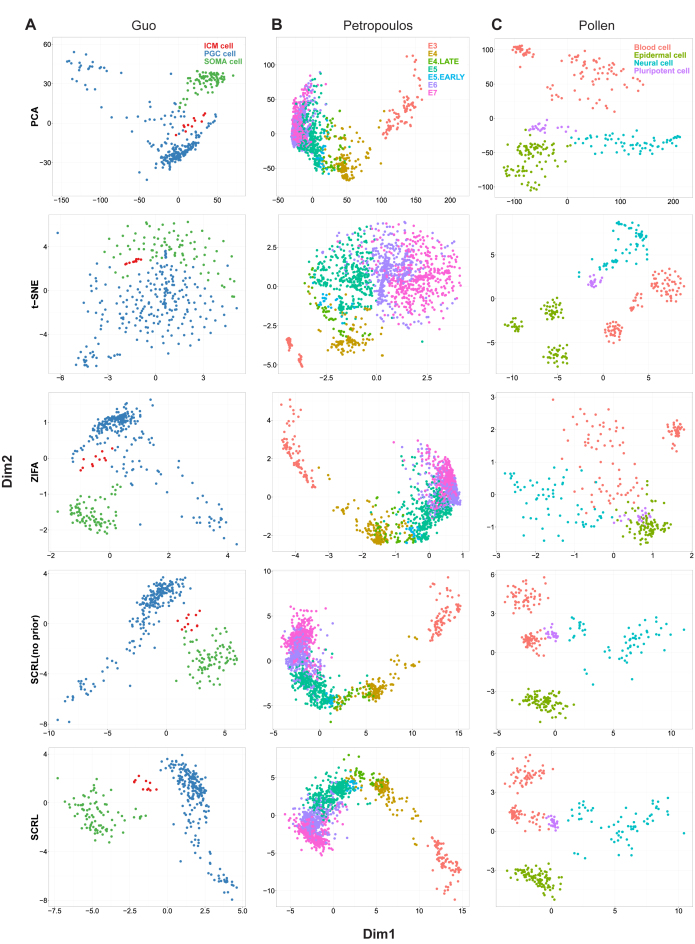
Figure 2.
Performance comparison of the four-dimensional reduction methods for visualization on the three datasets. (A) Guo dataset. (B) Petropoulos dataset. (C) Pollen dataset. Each point represents a cell and the cell is colored according to its known cell type label. SCRL (no prior) represents the method without using the pathway information.

