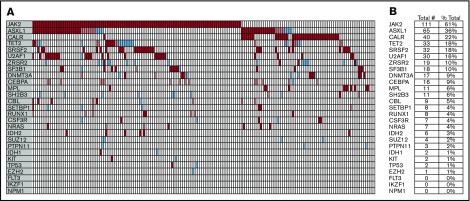
Figure 1.
Twenty-seven-gene panel DNA sequence variants in Mayo Clinic patients with PMF (n = 182). (A) Co-segregation plot for individual variants/mutations in PMF. Each column represents 1 patient. Variants/mutations are depicted by representative colored bars. Red: variants previously associated with a hematologic malignancy, identified as being somatic and present with ≤1% MAF; Pink: variants previously associated with a hematologic malignancy and present with ≤1% MAF; Blue: variants not previously associated with a hematologic malignancy and present with ≤1% MAF. (B) Total variants/mutations in PMF ranked by gene and corresponding overall frequency percentage.

