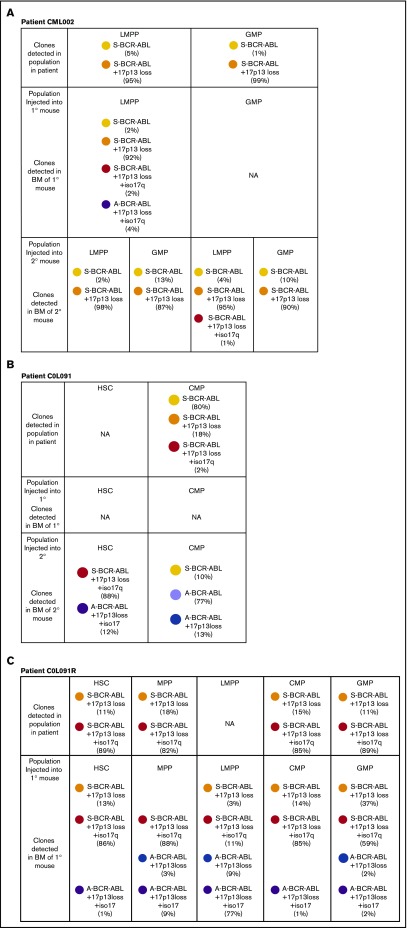
Figure 6.
Analysis of clonal structures in NSG mice after transplantation of stem/progenitor populations. Frequency and type of leukemic clones in individual engrafted mice. Injected populations indicated. Results from 1° (A, B, C) and 2° transplantation (A and B) are shown. BM, bone marrow; NA, cells unavailable for FISH analysis.

