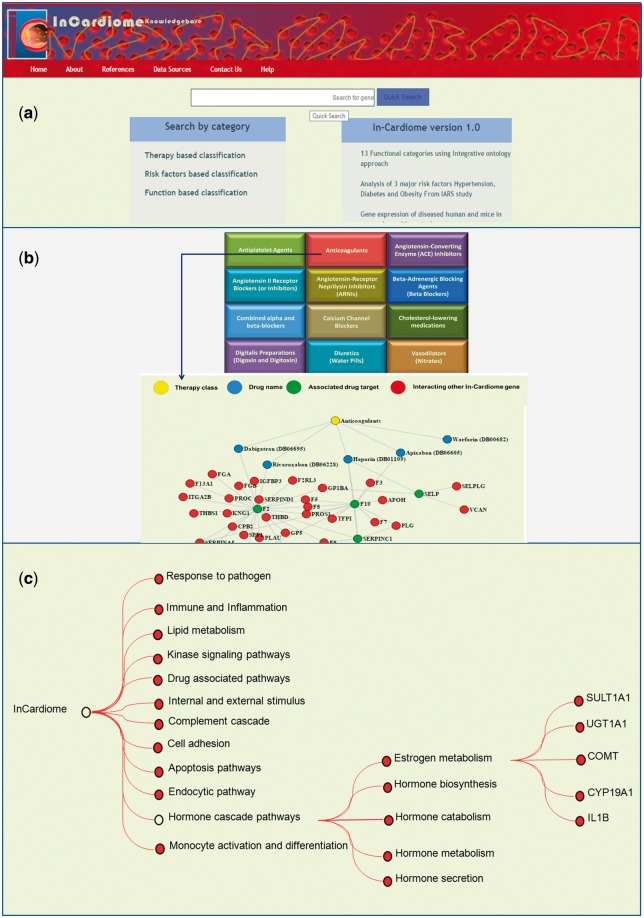
Figure 2.
(a) Homepage of In-Cardiome knowledgebase. (b) Therapy/drug based categorization of information where upon clicking on specific therapy module, the user will be able to see the all the approved drugs, their targets and interacting proteins of those target genes. Each category has been shown with different color where yellow color circle shows drug class, blue color circle shows drug, red color circle indicates drug target and green nodes represents interacting In-Cardiome gene which may play important role in disease and therapy. (c) Function based classification of genes. Based on the 75 parental ontologies of 4905 GOs of 995 genes, 12 clusters were identified. Upon clicking on the any one function the user will be able to see POs and respective genes.

