
Fig. 4.
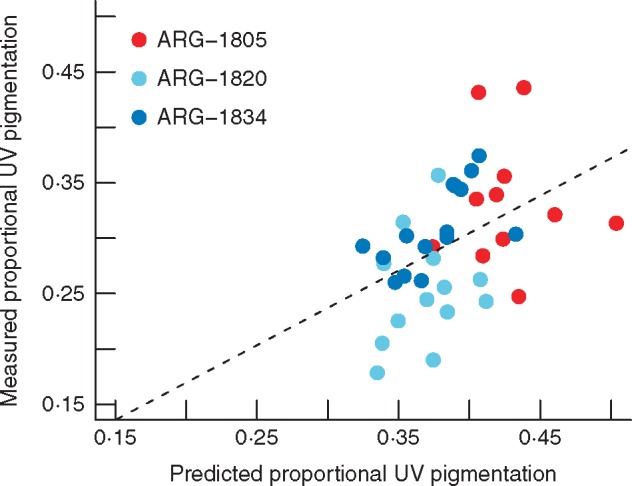
QTL-predicted proportional UV pigmentation versus observed values in individuals from three natural populations. ARG-1805 and ARG-1834 are the F2 mapping population parent accessions, while ARG-1820 is an accession with significantly smaller proportional UV pigmentation. The dashed line represents the linear model regression line (F1,32 = 6·21, P = 0·018, adj. R2 = 0·136).