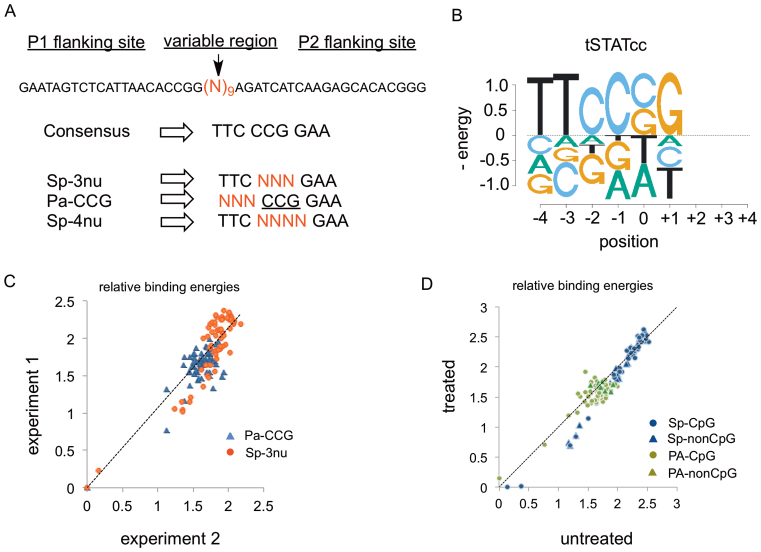
Figure 2.
(A) DNA libraries. Designed based on GAS-consensus sequence. The randomised region was flanked by two primer-binding regions (P1 and P2) for amplification and indexing, followed by sequencing. (B) Binding energy logo for tSTATcc, involving the single-mutant of the preferred sequences in the Sp-3nu and Pa-CCG libraries. All energies are in units of kT. (C) Comparison between the relative binding energies of Sp-3nu and Pa-CCG libraries from two separate experiments. (D) Ratio of the binding energies of sequences in Sp-3nu (blue) and Pa-CCG (green) library that either have at least one CG dinucleotide (circles) or do not have any CG dinucleotide (triangles). Y-axis represent libraries treated with CpG methyl transferase whereas, X-axis represent untreated libraries.

