Figure 1.
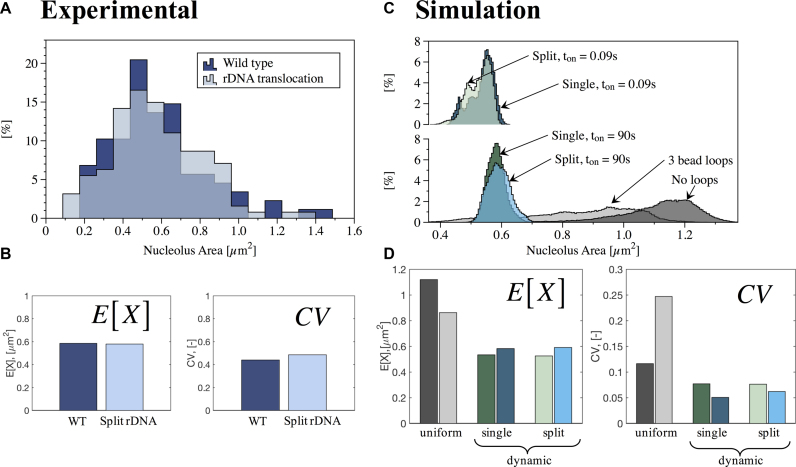
Quantitative analysis of nucleolus area in wild-type (WT) and rDNA translocation strains. (A) Histogram of experimental results for WT (88 cells) and rDNA translocation (127 cells). Y-axis is percentage in each bin. (B) Measures of central tendency (Expected value, E[X]) and dispersion (Geometric coefficient of variation, CV) obtained from best fit to lognormal distributions to experimental data in (A). (C) Histogram of simulations results for no crosslinks, uniform crosslinks and dynamic crosslinks, with Keq = 9 and two different (slow and fast) binding times ton for single and split nucleolus. Y-axis is percentage in each bin. (D) Measures of central tendency (E[X]) and dispersion (CV) obtained from best fit to lognormal distributions of simulated data in (C). Color code for panels (C) and (D): No crosslinks (dark gray), uniform crosslinks with 3 beads per loop (light gray), dynamic crosslinks, single nucleolus, ton = 90 s (dark green), dynamic crosslinks, single nucleolus, ton = 0.09 s (dark blue), dynamic crosslinks, split nucleolus, ton = 90 s (light green) and dynamic crosslinks, split nucleolus, ton = 0.09 s (light blue).

