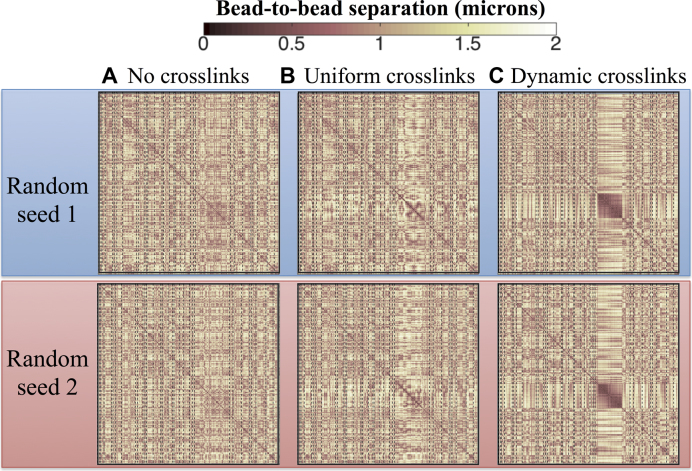
Figure 4.
Contact Maps depicting the average 3D bead-to-bead distance over 15 min. Each plot corresponds to datasets from six independent simulations; however datasets in the same row (top or bottom) use the same random seed and only differ on the type of crosslinking imposed in the nucleolus. Dynamic crosslinking dramatically increases nucleolus connectivity, whereas uniform crosslinking has a far lesser effect. (A) No crosslinks, (B) 3-bead uniform loops, (C) Dynamic crosslinking (Keq = ton/toff = 9, ton = 0.09 s). X- and Y-axis in each contact map correspond to bead numbers (1–2443), where bead 1 is the first bead in the chain corresponding to arm 1 of chromosome I and bead 2443 is the last bead in the chain representing arm 2 of chromosome XVI.

