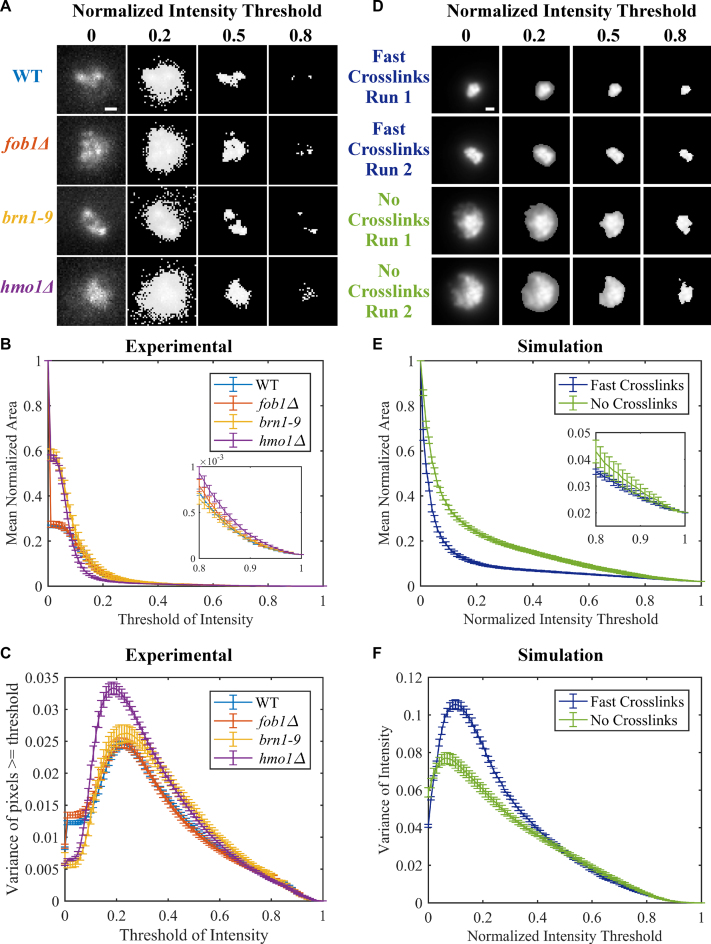
Figure 5.
Area and variance of experimental and simulated nucleolar signals. (A) Representative images of CDC14-GFP in WT, fob1Δ, brn1–9 and hmo1Δ at different fractional intensity thresholds. Images are maximum intensity projections of Z-stacks through the cell. Images were normalized by subtracting minimum pixel value and then dividing by the maximum pixel value for each image. Thresholding of images set all pixels below indicated normalized intensity threshold to 0. Scale bar is 0.5 μm. (B) Normalized area of CDC14-GFP signal over all intensity thresholds. Error bars are S.E.M. WT (n = 179), fob1Δ (n = 70), brn1–9 (n = 41) and hmo1Δ (n = 77). Inset is zoomed in portion of graph from threshold of intensity from 0.8 to 1. (C) Variance of CDC14-GFP signal above the normalized intensity threshold. Error bars are S.E.M. (D) Simulated images of two iterations of fast, dynamics looping and no looping simulations. Images were normalized as in (A). (E) Normalized area of simulated nucleolar signal over all intensity thresholds. Image area was normalized to total image area. Error bars are S.E.M. Fast looping (n = 10), no looping (n = 10). Inset is zoomed in portion of graph from threshold of intensity from 0.8 to 1. (F) Variance of simulated nucleolar signal above the normalized intensity threshold. Error bars are S.E.M.

