Figure 6.
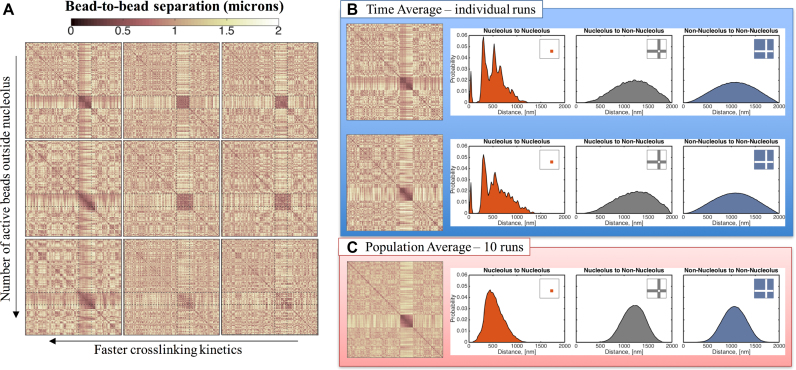
Nucleolus and genome-wide interactions as functions of crosslinking parameters. (A) Faster kinetics (lower ton) result in more interactions within the nucleolus. From left to right ton = 0.09, 0.9 and 90 s. Dynamics outside the nucleolus are controlled by the number of beads that are actively crosslinking. From top to bottom: all beads outside the nucleolus are inactive, every tenth bead is active and every third bead is active. All contact maps correspond to an average over 15 min for a single run. All data shown are simulated using the same random noise. (B) Distribution of bead-to-bead distances for dynamic crosslinking with Keq= 9 and ton= 0.09 s. Sub-structures within the nucleolus are formed by groups of beads that interact more frequently, leading to the darker regions in the contact maps and the peaks in the distribution functions. Although dynamic, these sub-structures persist over time for a given run (see Supplementary Movie 1) and vary from run to run. Top and bottom panels correspond to the same model parameters but different random seed. (C) The sub-structures are lost in the population averages resulting in a more uniform distribution of bead-to-bead distances within the nucleolus. X- and Y-axis for each contact map correspond to bead numbers, as explained in Figure 4.

