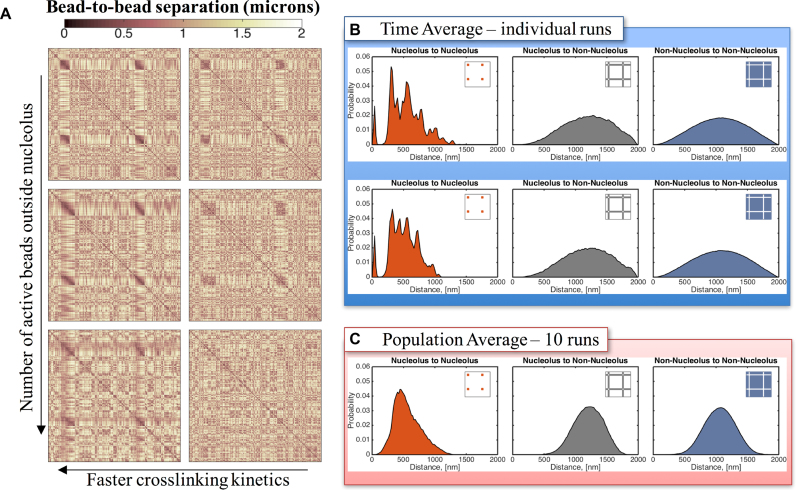
Figure 8.
Distribution of bead-to-bead distances for split nucleolus. (A) Contact maps show that there is a marked increased in bead interactions within the nucleolus as a function of decreasing the on/off times of binding (left to right). Faster (weak) kinetics results in more interactions. Left column ton = 0.09 s, right column ton = 90 s. Active beads outside the nucleolus are introduced to account for binding interactions throughout the nucleus. In the non-nucleolar chromatin, interactive beads are inactive outside the nucleolus (stride zero—top row), every tenth bead is active (stride 10) and every third bead is active (stride 3—bottom row). (B) Sub-structures within the nucleolus are formed by clusters of beads that are closer, interact more frequently and maintain some separation between clusters. These fluctuating sub-structures create darker regions in the contact maps and peaks in the bead–bead proximity histograms within the nucleolus. Although dynamic, these sub-structures persist over time for a given run (see Supplementary Movie 3) and are robust from run-to-run although the nucleolar bead cluster assignments are random. Top and bottom panels correspond to the same model parameters but different random seed. (C) The sub-structures are lost in the population averages, even though the cluster morphology is robust, because of random cluster assignments, resulting in a more uniform distribution of bead-to-bead distances within the nucleolus. X- and Y-axis for each contact map correspond to bead numbers, as explained in Figure 4.

