Figure 5.
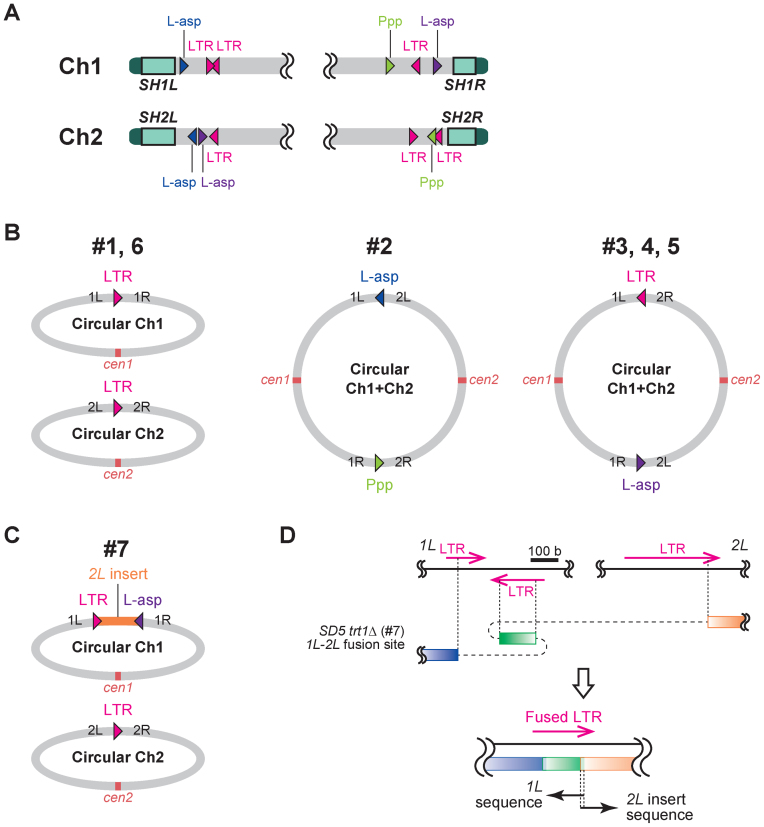
Chromosome-end fusions at homologous genomic loci in SD5 trt1Δ survivors. (A) Map of homologous loci that mediated chromosomal fusions in SD5 trt1Δ survivors #1–7. L-asp, L-asparaginase. Ppp, phosphoprotein phosphatase. Four L-asp genes were classified into two groups colored blue or purple according to their homology (see main text). Triangles indicate the 5′ to 3′ direction of the sequences. Note that positions of the loci are not in scale (see Supplementary Figure S7 for the precise representation). (B) Conformation of chromosomes 1 and 2 in SD5 trt1Δ survivors #1–6. Gene loci at the fusion points are indicated. DNA sequences of the fusion sites are shown in Supplementary Figure S7. (C) Chromosome conformation of SD5 trt1Δ survivor #7. Top panel indicates circularized chromosome 1 using the 2L sequence (2L is inserted). DNA sequences of the fusion sites are shown in Supplementary Figure S7. (D) Schematic illustration of the complex fusion between 1L and 2L in SD5 trt1Δ survivor #7 shown in the top panel in (C). Blue box, IL-specific region; green box, inverted LTR sequence in IL; orange box, 2L-specific region. See Supplementary Figure S7 for details.

