Figure 3.

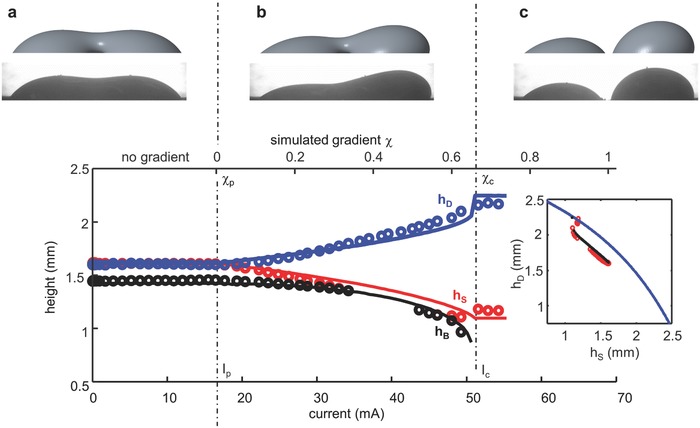
Comparison of Surface Evolver surface tension gradient simulation (plotted as solid lines) to experimental photos (plotted as circular points). a) No gradient. b) Just prior to separation. c) Just after separation.

Comparison of Surface Evolver surface tension gradient simulation (plotted as solid lines) to experimental photos (plotted as circular points). a) No gradient. b) Just prior to separation. c) Just after separation.