Figure 2.
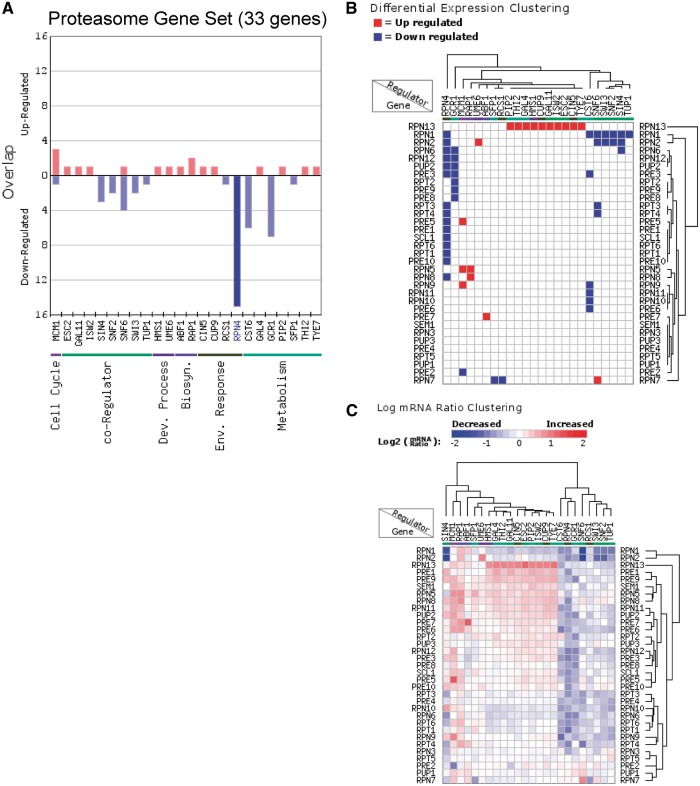
Analysis of the regulation of proteasome genes (33 genes) using the Gene Set Overlap and Regulator Cluster tools. (A) Overlap of up- or down-regulated target genes for each regulator in the transcription factor (yeast grown in YPD) category with the proteasome gene set. Only regulators with targets in this gene set are depicted. (B) Differential expression clustering, in which the gene expression changes are represented as up-regulated, down-regulated, or unchanged in each regulator mutant for genes in the proteasome gene set. (C) Log ratio clustering using the Regulator Cluster tool, in which the clustering is based on the log2 mRNA ratio of each gene in each regulator mutant.

