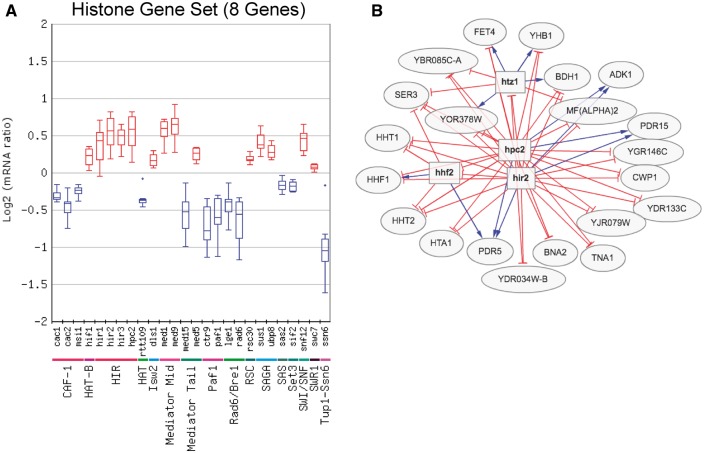
Figure 3.
(A) Box plot output of the Gene Set Viewer tool, displaying changes in the expression of the core histone genes (HTA1, HTA2, HTB1, HTB2, HHF1, HHF2, HHT1 and HHT2). A box plot depicting the log2 mRNA ratios of the histone genes for each regulator mutant in the chromatin regulator category is depicted. Only regulator mutants that significantly affect the expression of the histone gene set (calculated using Wilcoxon rank sum test, see methods) are displayed. Regulators are grouped by protein complex or functional category. (B) Target genes regulated by both the Hir2 and Hpc2 subunits of HIR histone chaperone and repressor complex, using a threshold of P < 0.05 and fold change >1.3 (up or down). Target genes were identified using the Regulator Targets tool, and the depicted network display is adapted from the output of this tool.

