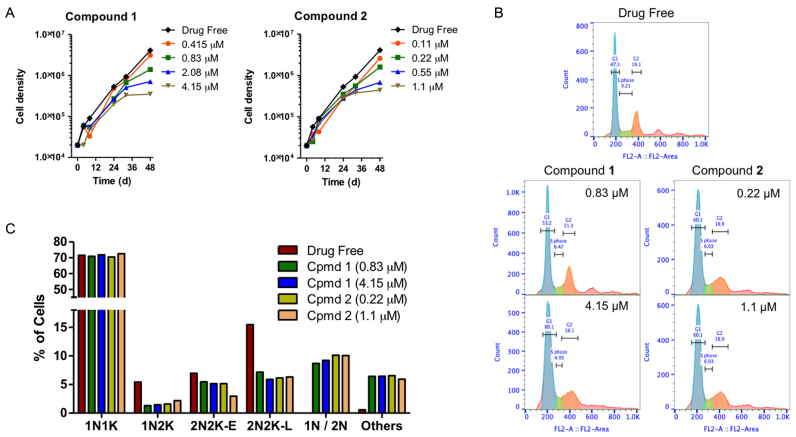
Figure 2.
(A) Growth curves of untreated control T. brucei 427WT and of parallel cultures treated with compounds 1 and 2 at 0.5, 1, 2 and 5 × their EC50 values. (B) Histograms of flow cytometric analysis of propidium iodide fluorescence associated with Tb427WT trypanosomes. The frames shown show control and exposed (1 × and 5 × EC50) to 1 or 2 for 24 h, with most cells in G1 phase (blue peak, single set of chromosomes) and smaller numbers in S-phase (green, DNA synthesis) and G2 phase (orange, 2 sets of chromosomes). (C) DNA content of cells treated 24 h with compounds 1 and 2 at 1 × and 5 × EC50 as determined by fluorescence microscopy (N, nucleus; K, kinetoplast; 1N/2N, cells with one or two nuclei but no observable kinetoplastid).

