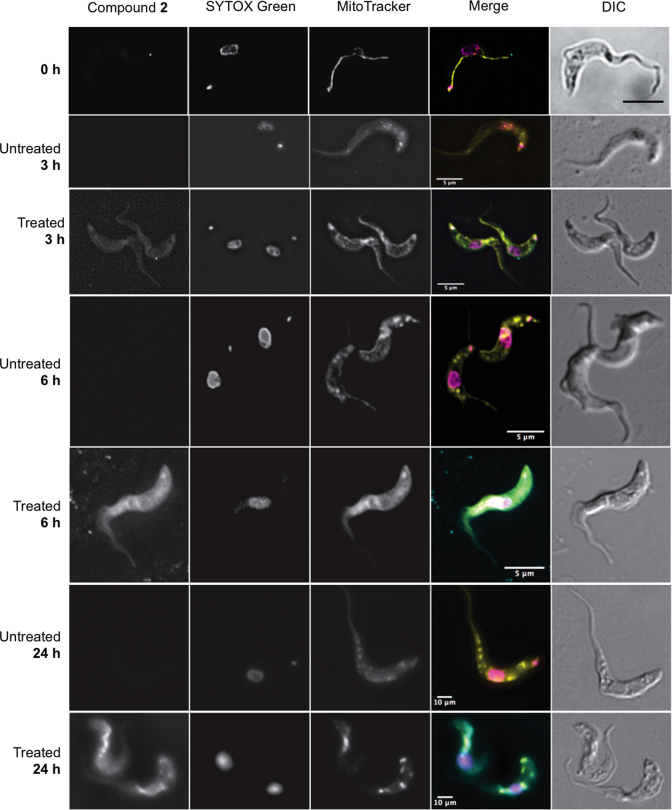
Figure 4.
Fluorescence localization of the compound 2 in Trypanosoma brucei s427-WT cells. Images were taken at 3, 6 and 24 h of incubation with 5 μM compound 2. Untreated cell samples were taken at each time point for drug free control. All fluorescent images are shown with compound 2 (λ = 450, blue channel), SYTOX Green (λ = 523, green channel), MitoTracker (λ = 599, red channel), and merge, where arbitrary colors were used to visualize the various dyes: blue for 2, purple for SYTOX, yellow for Mitotracker. The outline of all cells is shown by differential interference contrast (DIC) imaging. Images were acquired using a DeltaVision imaging system and deconvolved using the ratio conservative method, on SoftWoRx software.

