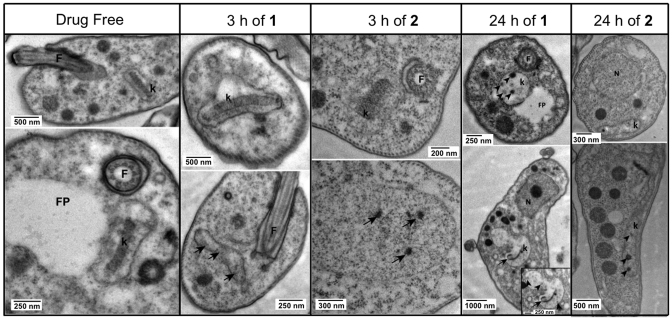
Figure 5.
TEM images showing normal ultrastructure of bloodstream form for treated and untreated (drug free control) cells of Tb427-WT after incubation with compound 1 or compound 2 for either 3 h or 24 h. F = flagellum, FP = flagellum pocket, k = kinetoplast. Images were observed in a Tecnai T20 (FEI) at 200 kV. Irregular structures in the kinetoplast are shown with arrows and arrowheads, indicating kDNA damage.

