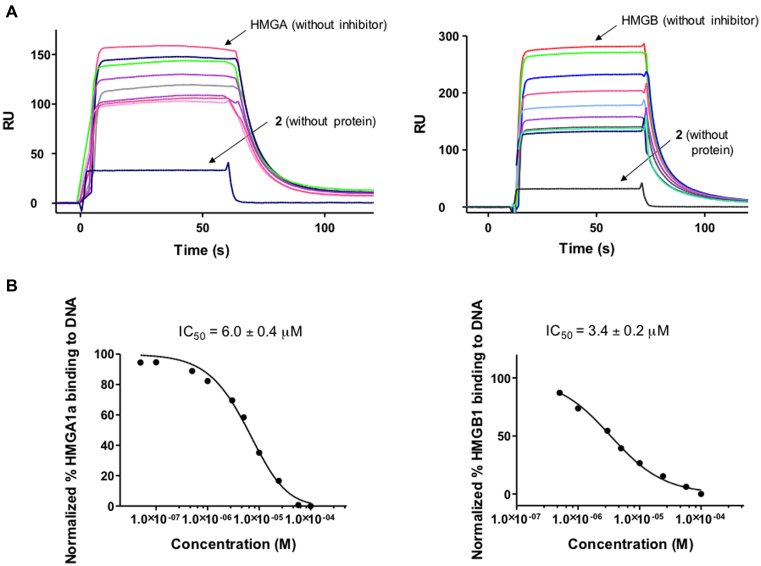
Figure 7.
(A) SPR competition sensorgrams showing the inhibition of a fixed concentration (2 μM) of HMGA1a (Top left panel) and HMGB1 (top right panel) binding to dsDNA containing AATAAT_ATTATT oligonucleotide in the presence of increasing concentration of 2. Concentration range from 0.05 to 200 μM (for HMGA1a) and 0.05 to 400 μM (for HMGB1). (B) Inhibition curves and IC50 values for inhibition of binding of HMGA1a (lower left panel) and HMGB1 (lower right panel) to dsDNA by compound 2.

