
Figure 4.
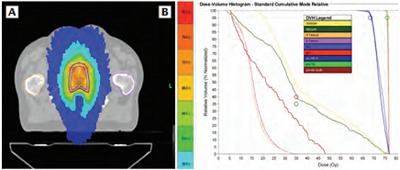
Patient 2, (A) dosimetry (axial) and corresponding (B) dose volume histogram showing gross tumor volume (red) treated to 76 Gy. Gross disease planning tumor volume is displayed in green and standard prostate fossa planning tumor volume is shown in blue. Hot-spot of 81.3 Gy.