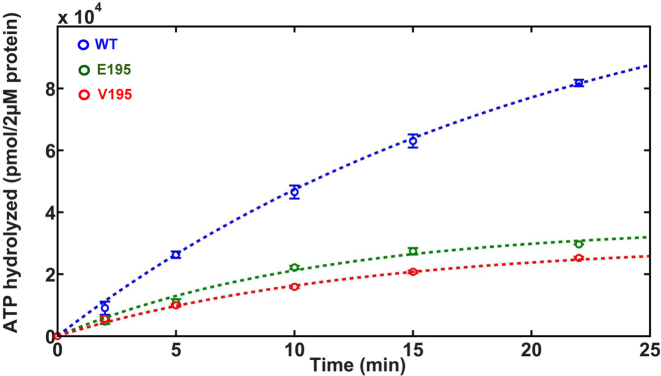
Figure 5.
E195 and V195 mutants show reduced rate of ATP hydrolysis. The amount of Pi formed with time was quantified for WT (blue), E195 (green) and V195 (red) gp17s using the standard ATPase assay. Data were fit to the expression A(t) = A∞(1 – exp(-kt)) (dashed lines) and the rates determined from the slope at t = 0. See Supplementary Materials and Methods for details.

