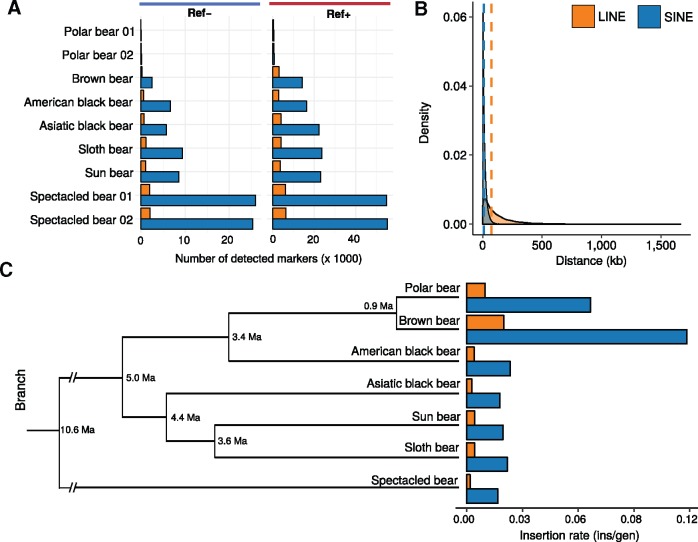
Fig. 2.
—Detection results for TE insertions calls and inferred TE insertion rates. (a) Counts of Ref − (left) and Ref + (right) TE calls per analyzed sample shown for long interspersed element (LINE) insertions (orange) and short interspersed element (SINE) insertions (blue). (b) Distance distribution of all detected TE insertions among all bears. Vertical dashed lines indicate median distances. (c) TE insertion rates as insertions per generation (ins/gen) for all ursine species were estimated for the terminal branches in a chronogram scaled to divergence times from Kumar et al. (2017).

