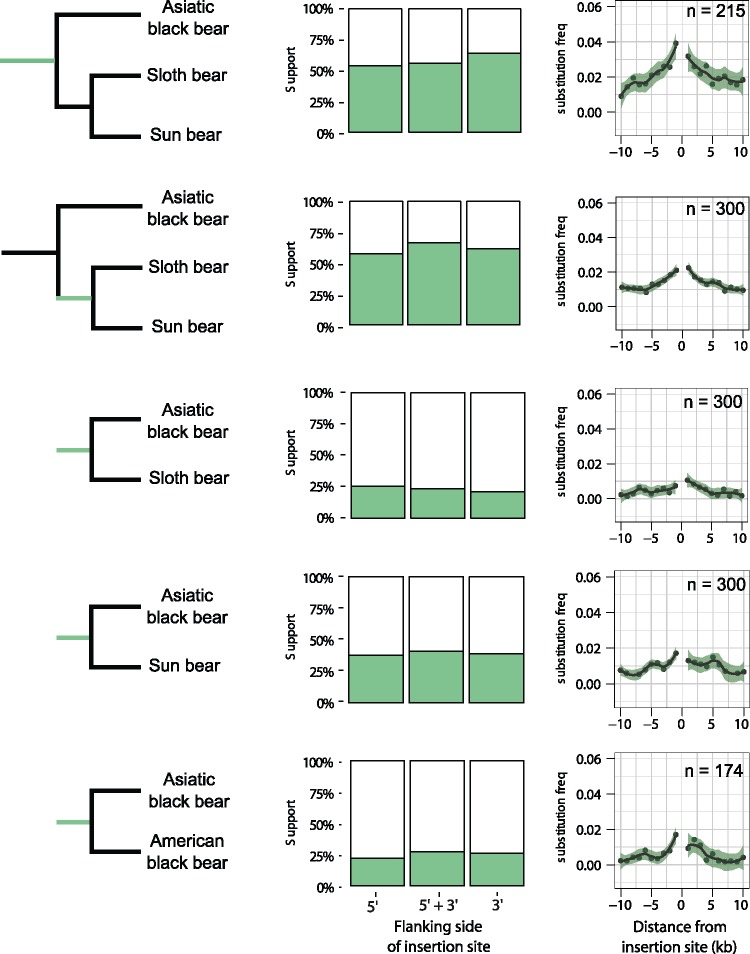
Fig. 6.
—Analysis of flanking sequences of TE insertions present in different groups of taxa. Left panel: Green branches in the phylogenetic tree indicate when the TEs integrated. Middle panel: Bar plots showing the frequency of ML-trees calculated from 10-kb flanking sequence on the 5′, 3′ end or a concatenation of both. Right panel: Frequency of substitutions that support the TE insertion signal in 1-kb windows around the insertion site. Frequencies are normalized by the number of segregating sites.

