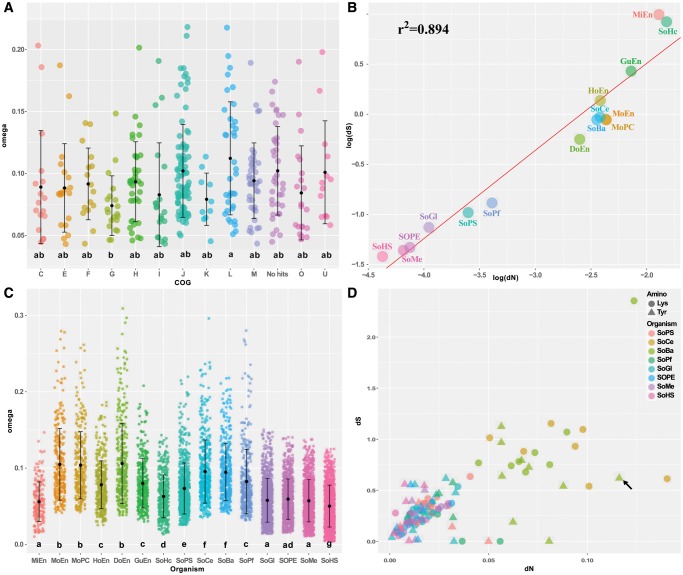
Fig. 7.
—Molecular evolution in different Sodalis species. (A) SoBa omega single gene values across different COG groups. (B) dN/dS correlation across different Sodalis lineages. Each dot represents the median dN/dS of all analyzed genes in each Sodalis lineage. (C) Omega single gene values across the different Sodalis species. (D) Scatter plot showing the dN and dS values for the OCPs belonging to the Tyr and Lys pathways in several Sodalis. The tyrA gene of SoBa is denoted by a black arrow. Only OCPs with omega values below 1 were used on (A) and (C). Lowercase letters in (A) and (C) represent the statistical significant groups obtained. Regression line on (B) was calculated using the PGLS method under a Brownian model of evolution.

