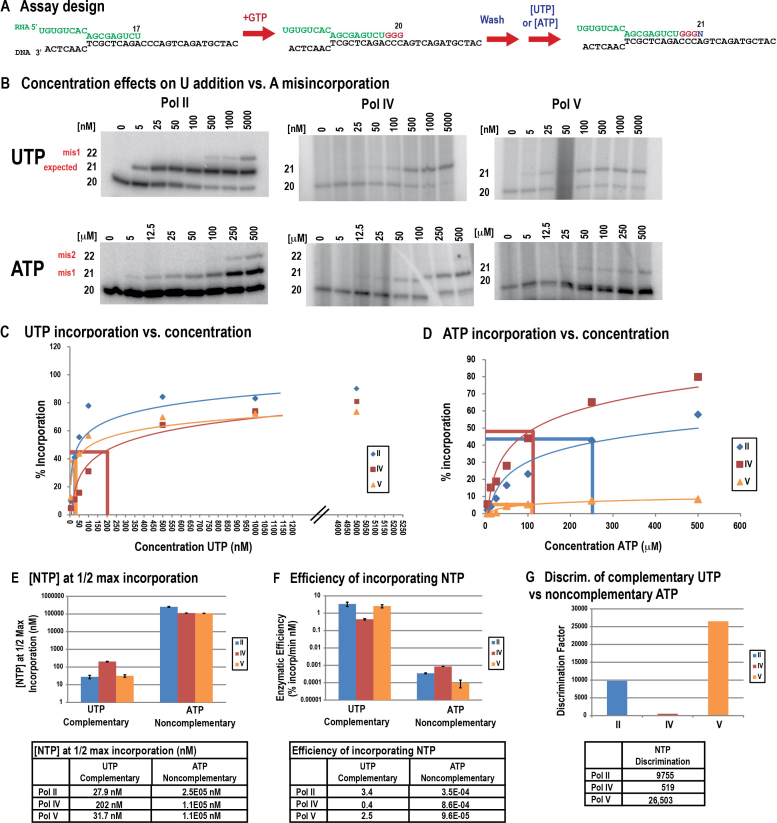
Figure 2.
Differences in complementary versus non-complementary nucleotide incorporation contributes to differences in Pol IV and Pol V fidelities, relative to Pol II. (A) Overview of the primer elongation assay. (B) Representative gels showing the incorporation of the complementary nucleotide (UTP) by Pols II, IV and V over a range of UTP concentrations. (C) Percent incorporation, calculated as the intensity of products of 21 and 22 nt divided by the total intensity of products 20 nt or longer) is plotted versus nucleotide concentration, with linear regression used to fit the curves to the equation y = (Imax*x)/(Km*+x). (D) Percent incorporation (intensity of 21 and 22 nt products divided by the total intensity of products 20 nt and longer) plotted versus nucleotide concentration, with linear regression used to fit the curves to the equation y = (Imax*x)/(Km*+x). (E) Km* values (nucleotide concentration at  maximum incorporation (Imax)) of Pols II, IV and V for complementary and non-complementary NTPs. Data is representative of two replicate experiments (see Supplementary Figure S2). (F) Efficiency of nucleotide incorporation (Imax/Km*). (G) Discrimination factor, calculated as complementary NTP efficiency/non-complementary NTP efficiency.

